Data
Wire up real data
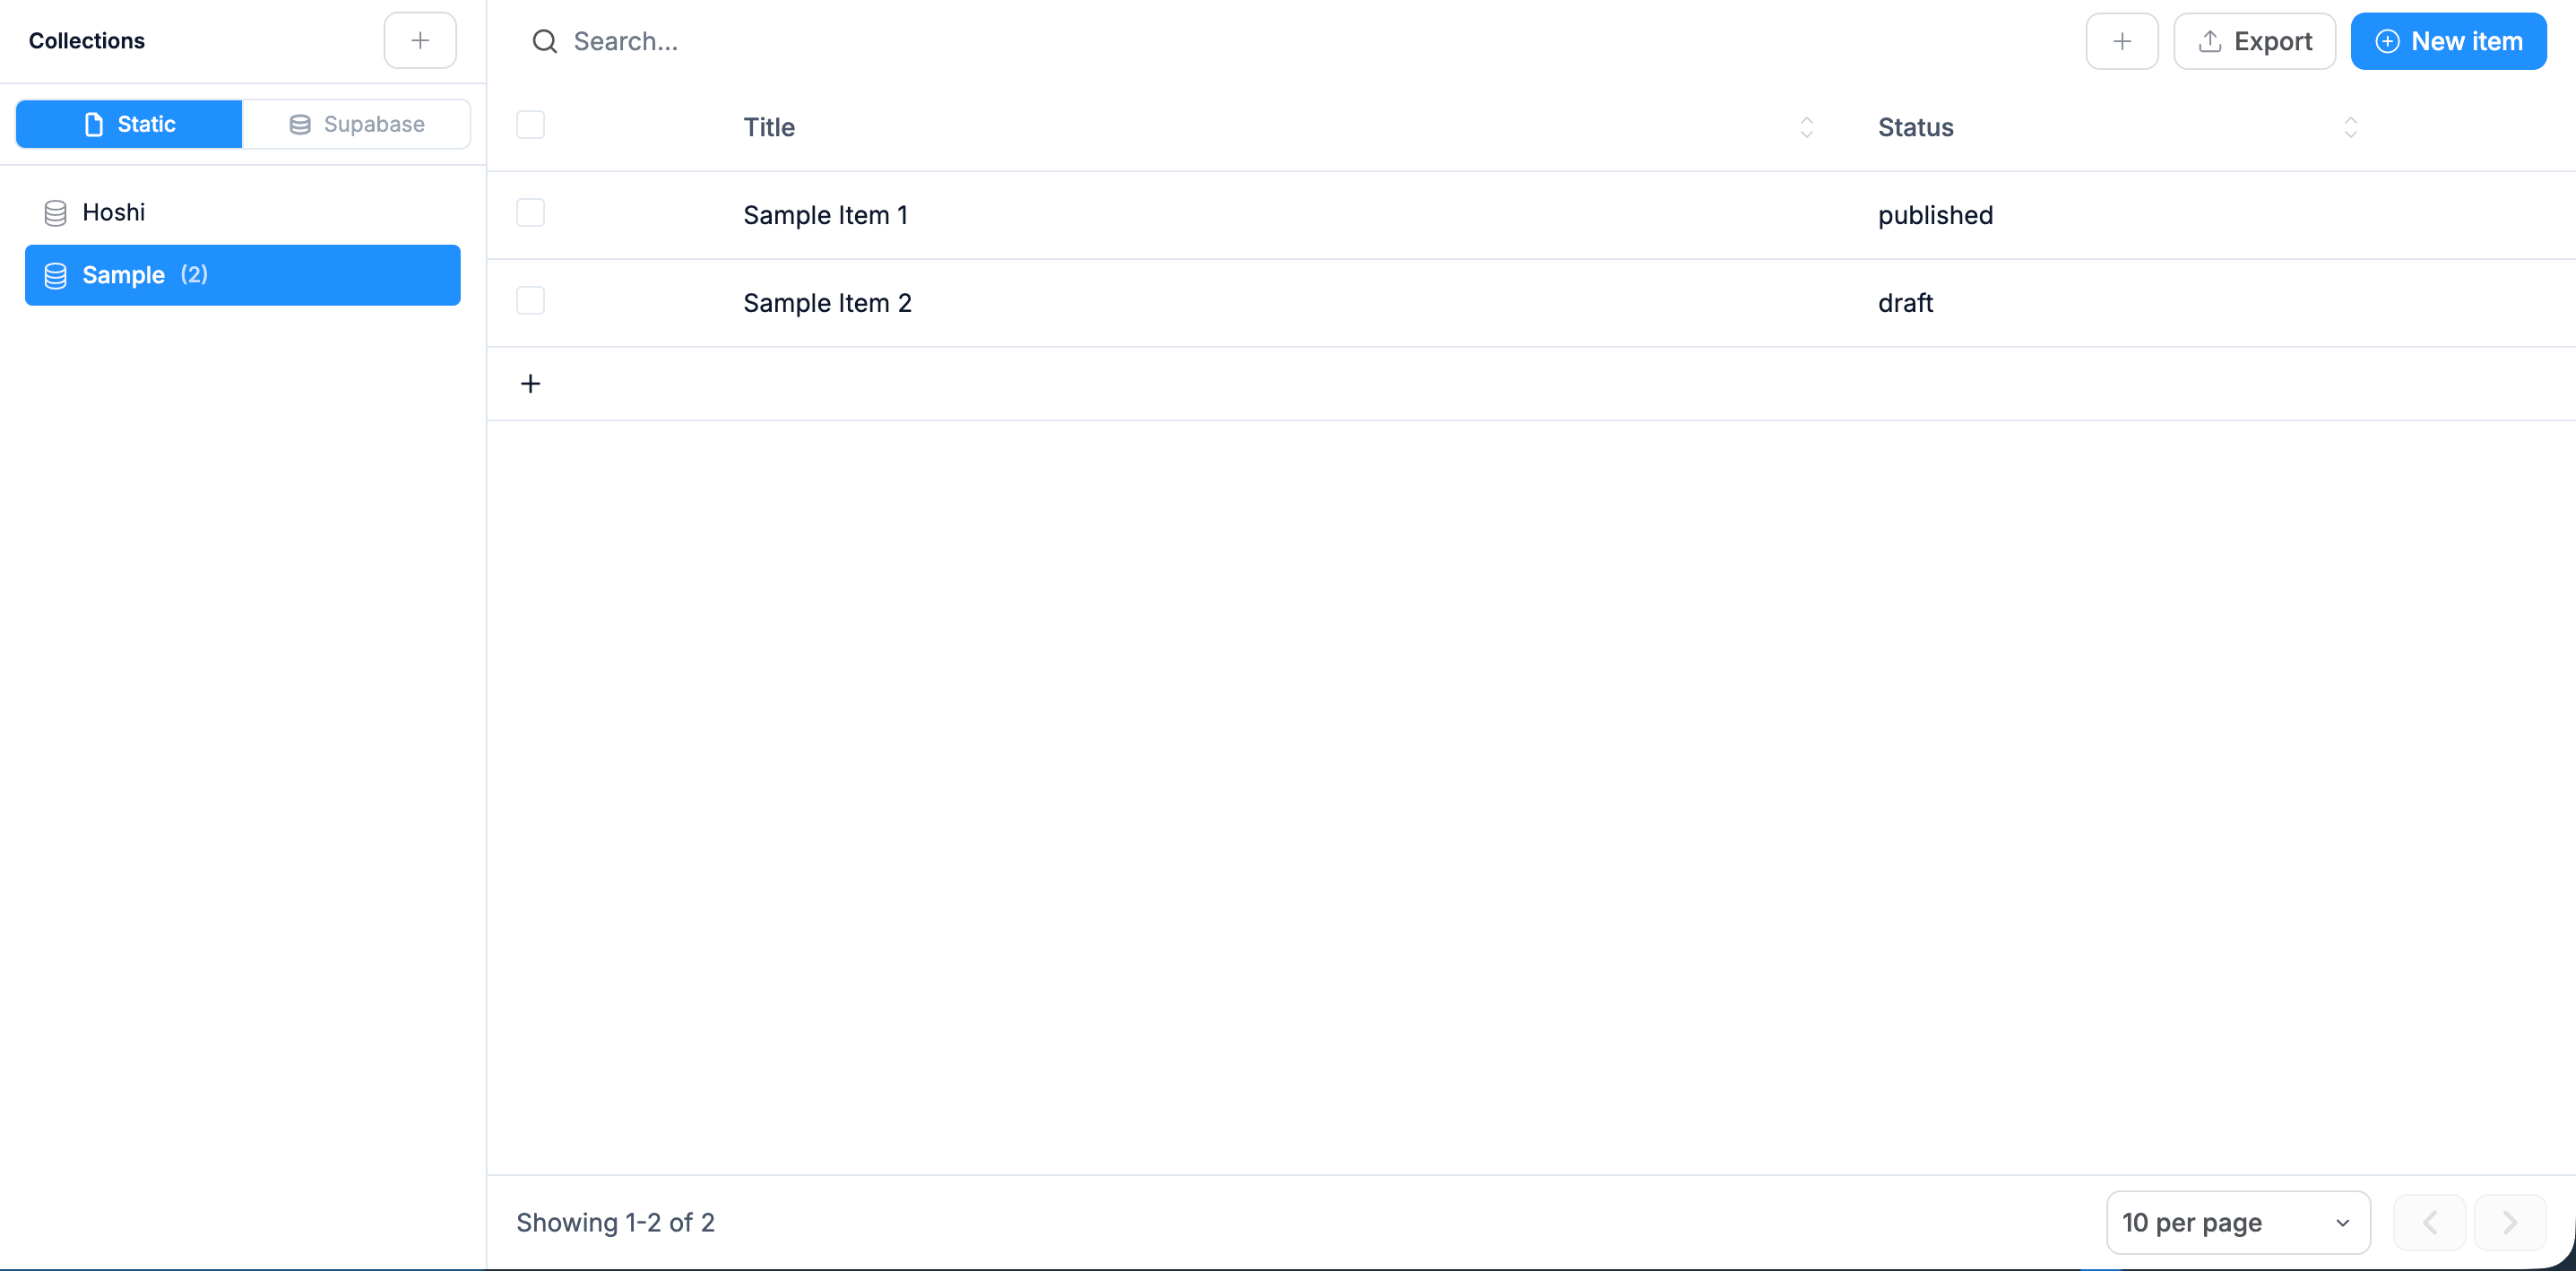
Databases and CMS that power your live app, no backend to set up.
Active users, funnels, cohorts, custom events. Generated for your team's actual KPIs, not whatever Mixpanel's default dashboard shows.
01 / What you get
Click Generate from the box above. Real code, a real database, real integrations, not a sandbox. Each piece below ships in the first prompt.
DAU/WAU/MAU charts pulled from any events source (Postgres, PostHog, Mixpanel API)
Funnel builder: define ordered events, see drop-off rates, segment by user property
Cohort retention: signup-week cohorts retained at week 1, 4, 12, 26
Custom event explorer: search events by name, filter by property, chart over time
Saved views per dashboard so the team comes back to the same numbers
02 / Variants
Databases and CMS that power your live app, no backend to set up.
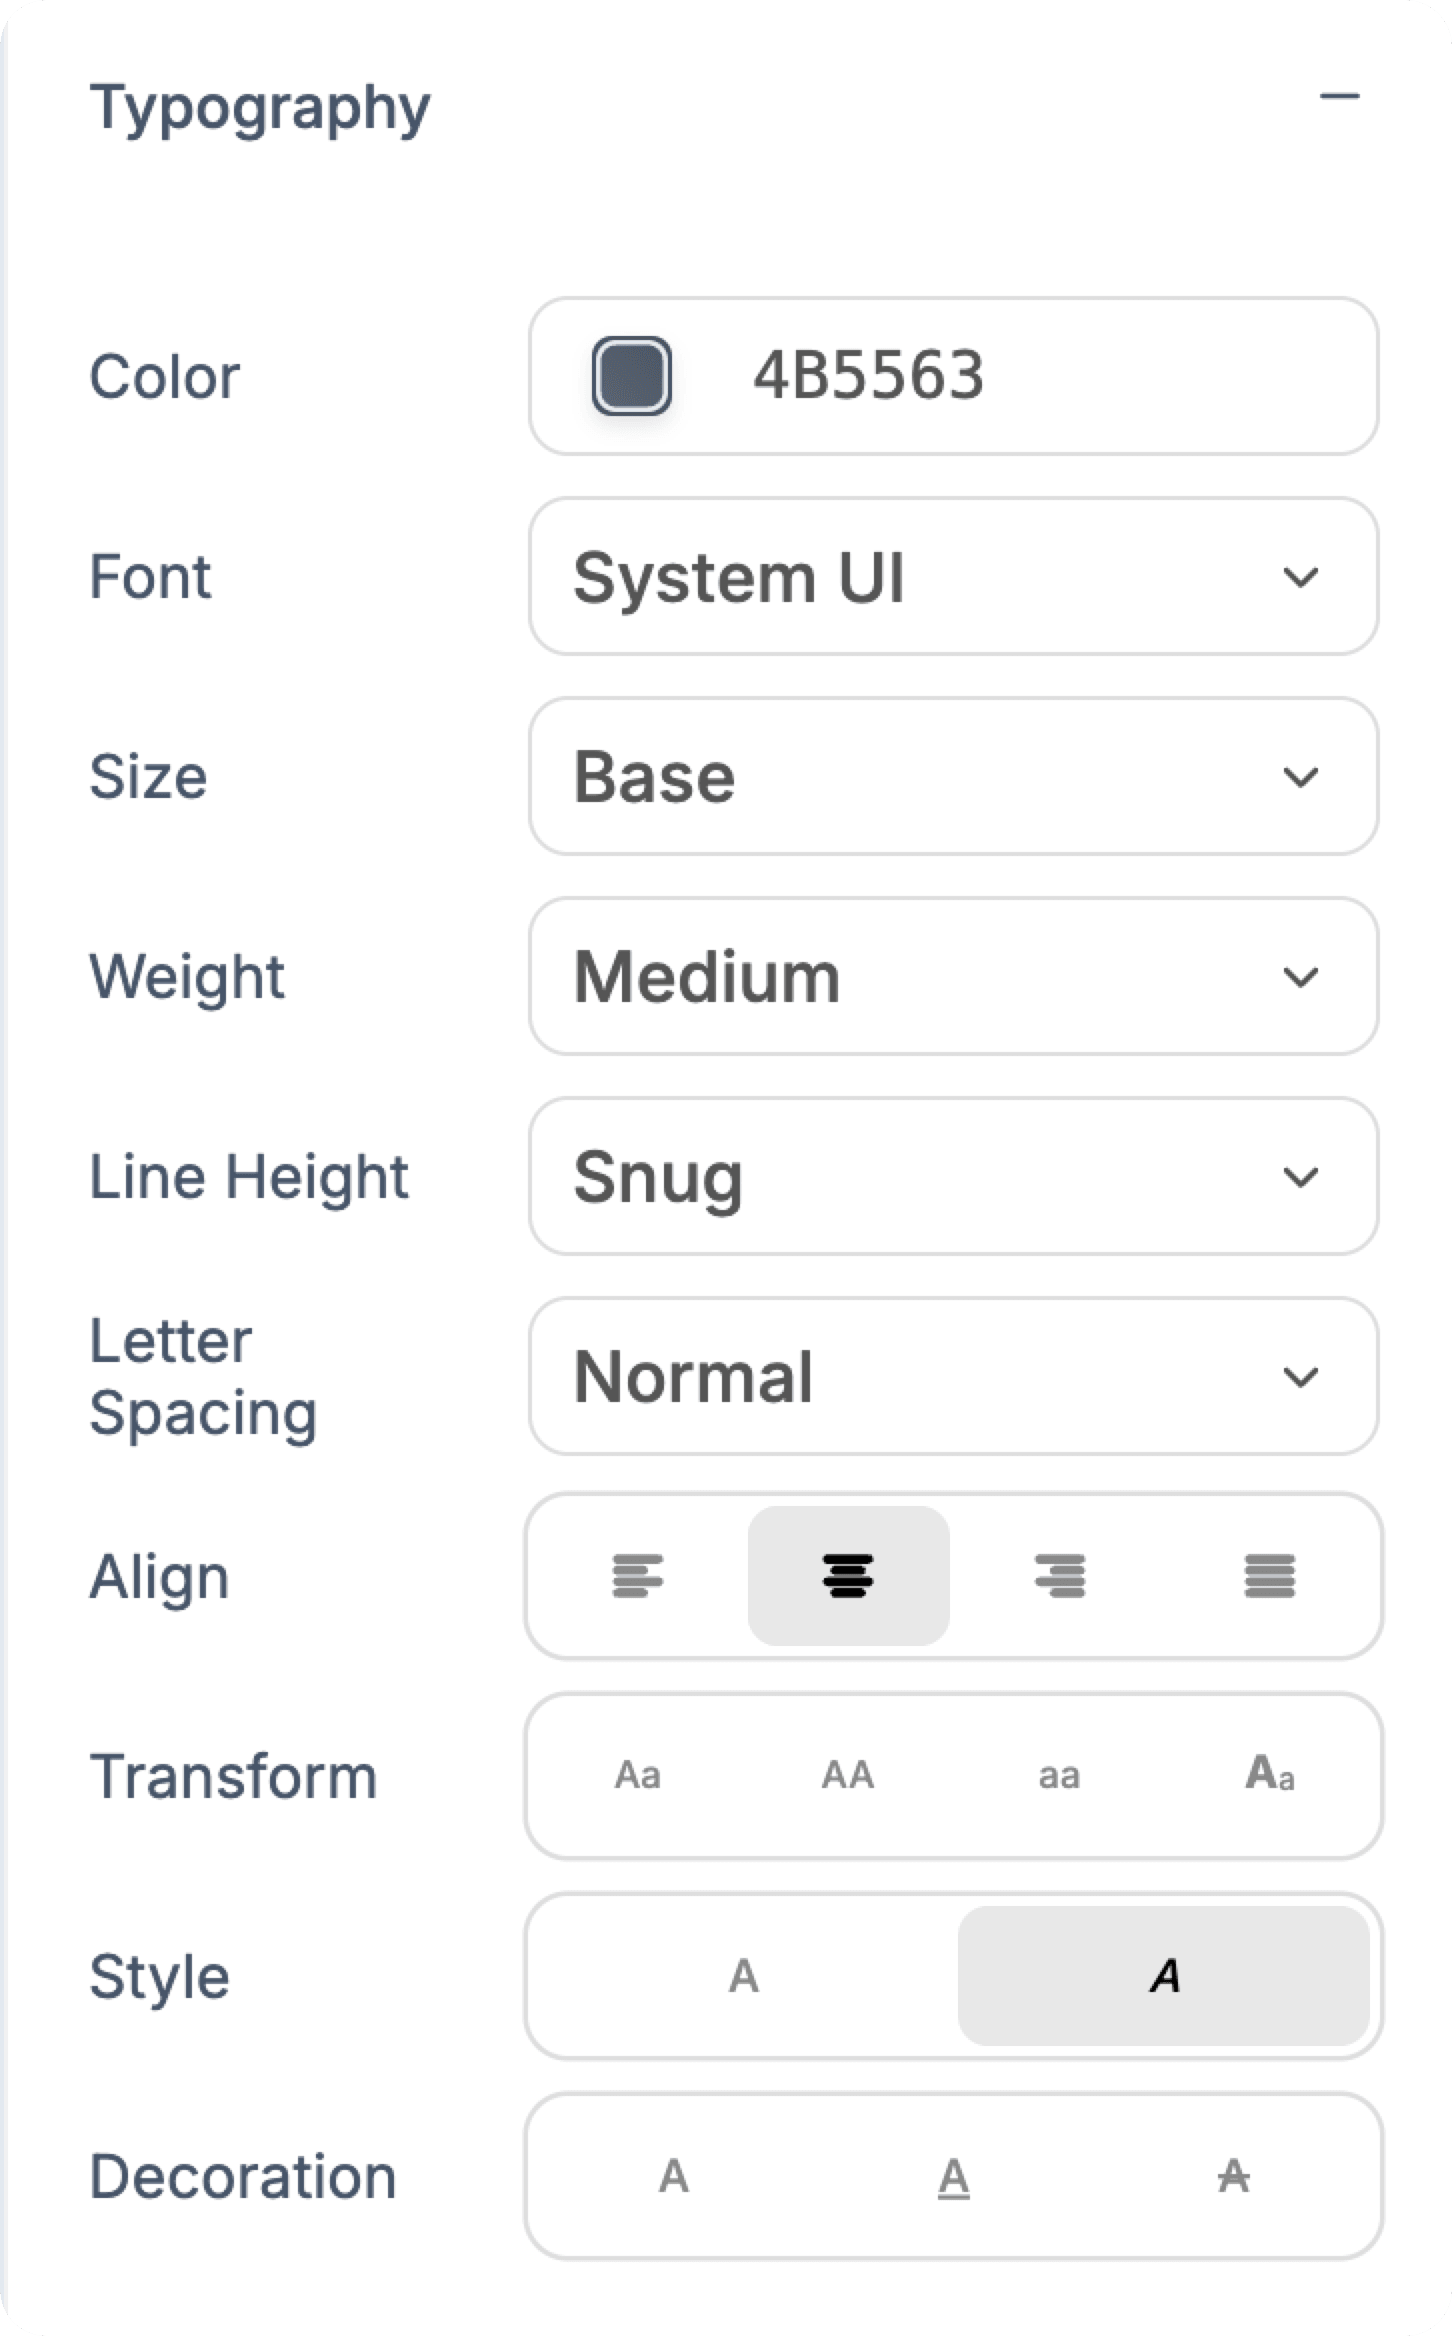
Font, size, weight, leading and spacing, all by hand.
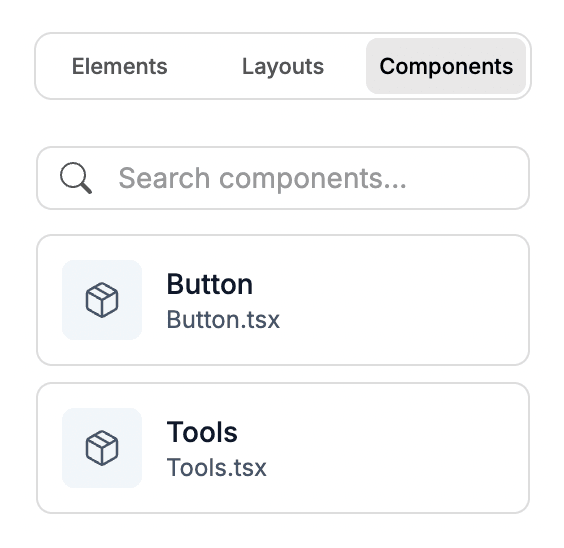
Save any section and drop it in anywhere.
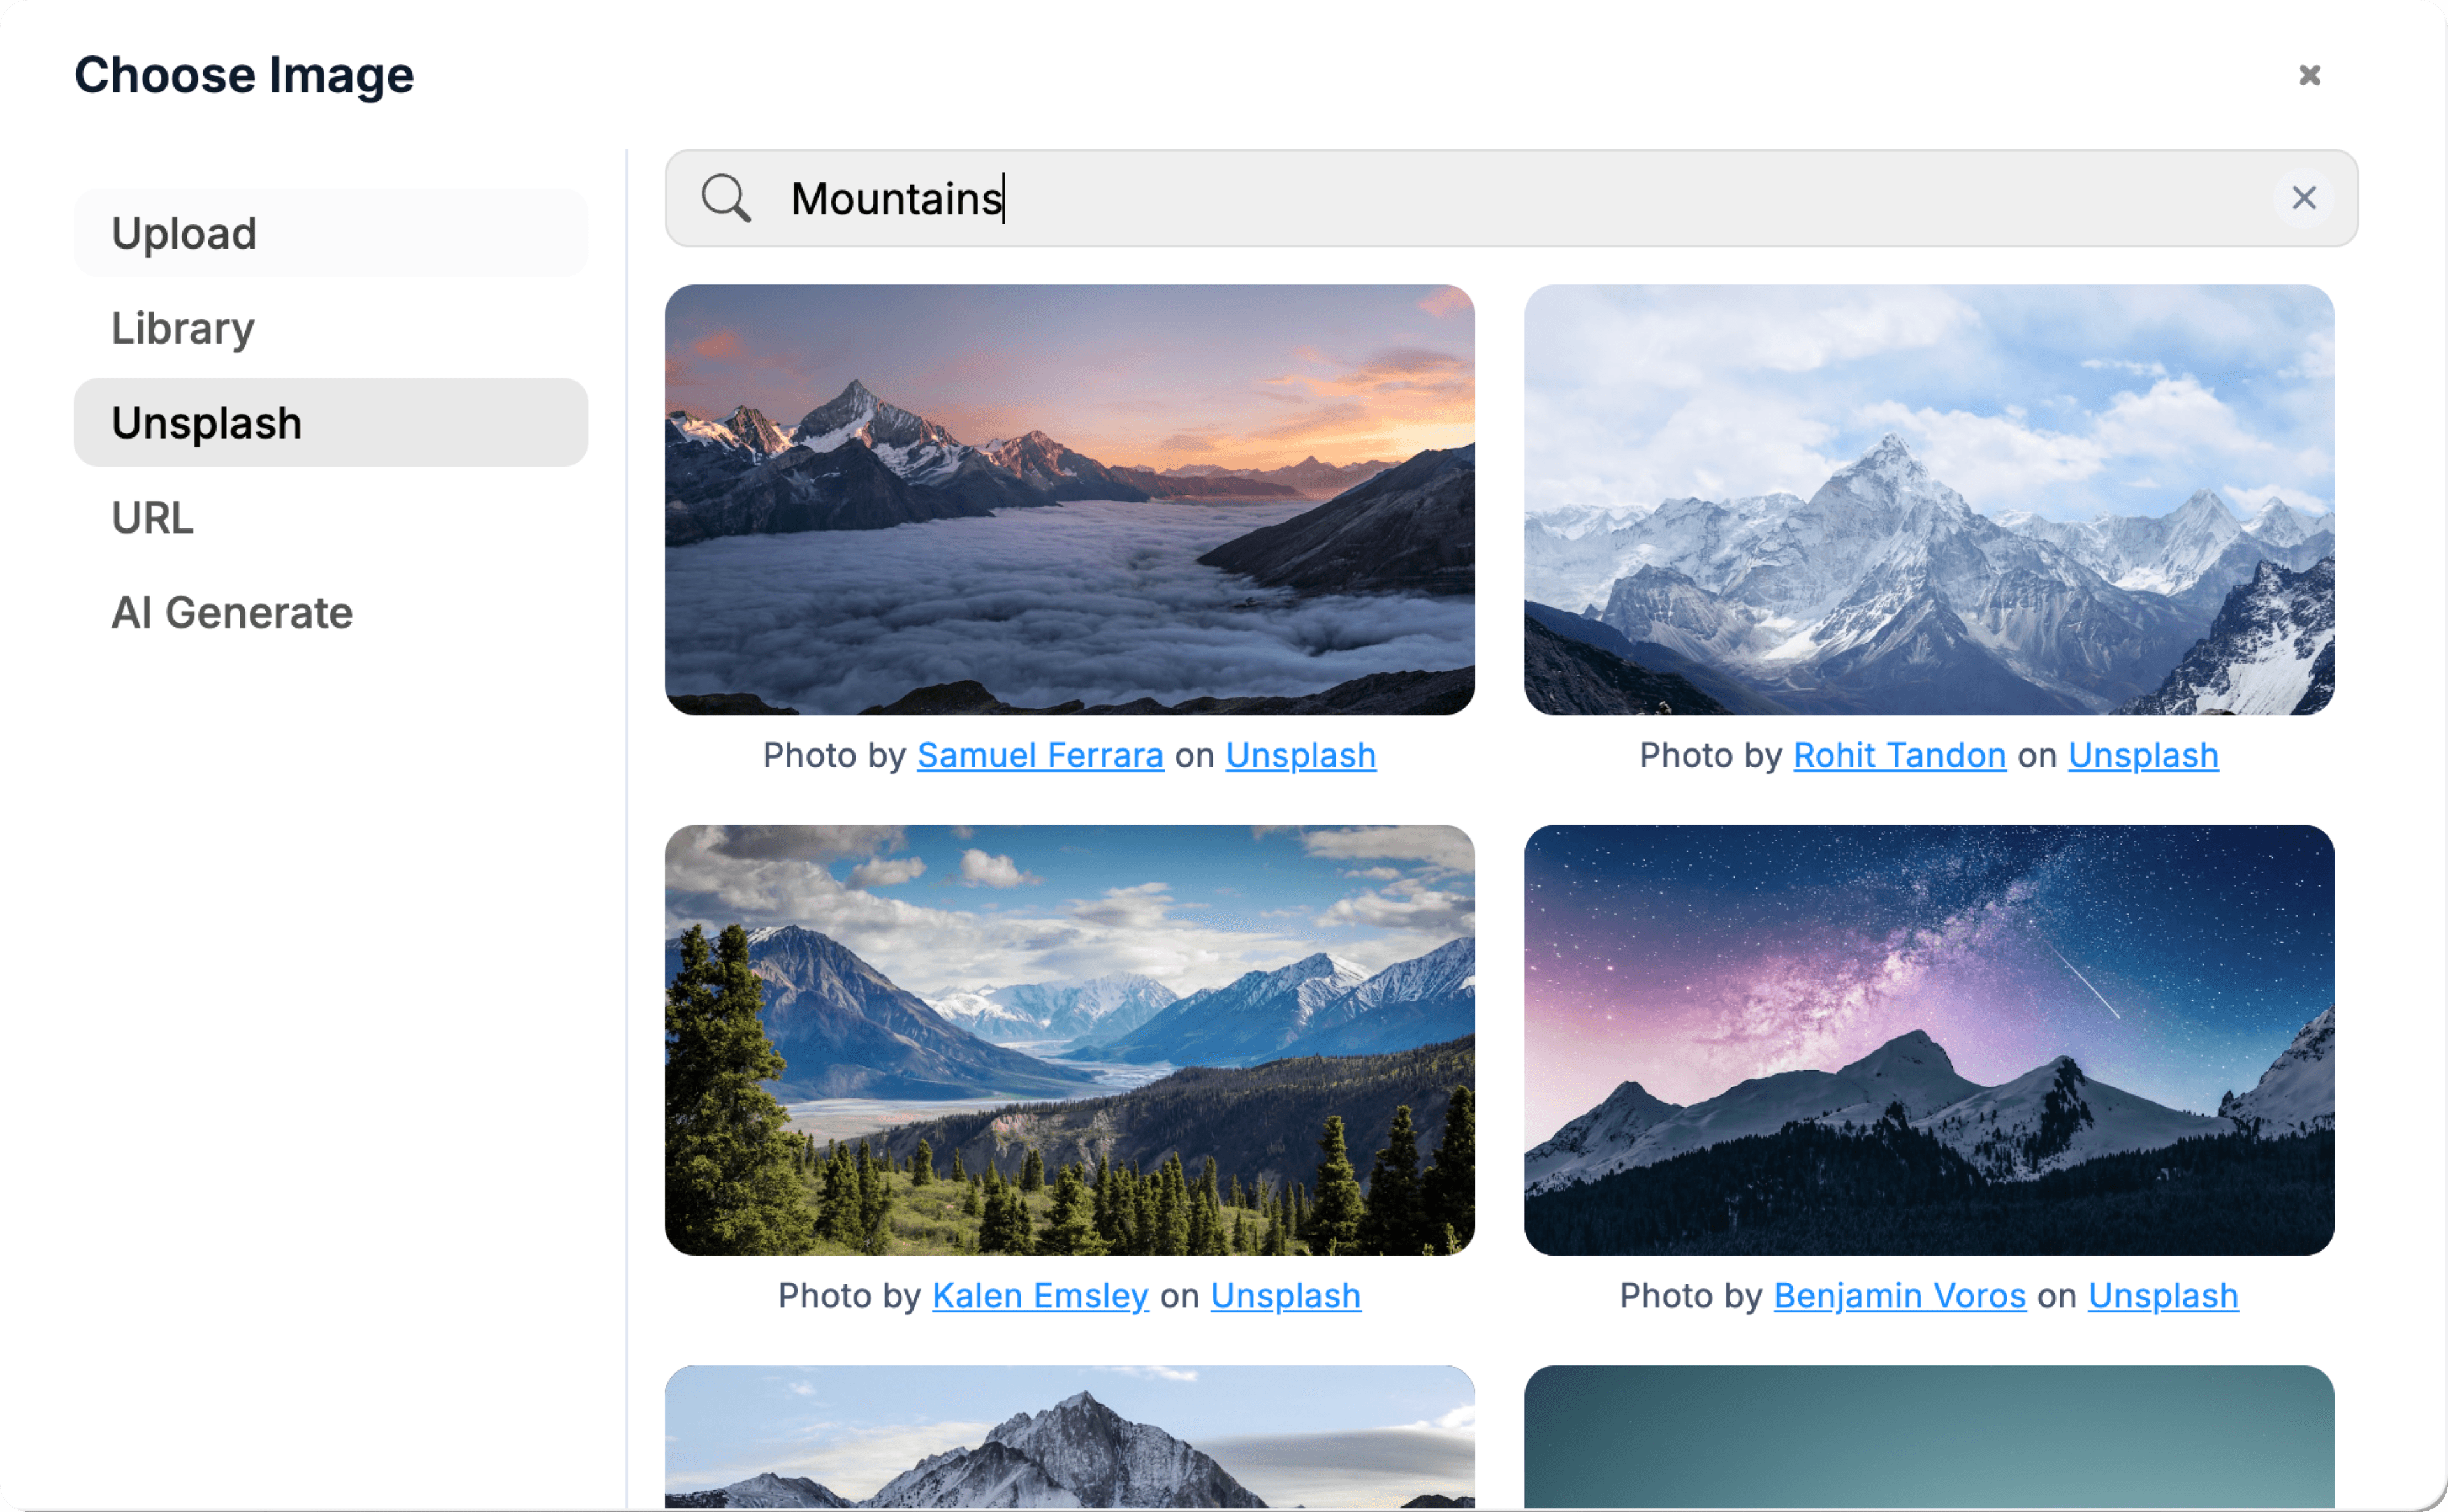
Pull in free imagery without leaving the canvas.

03 / Who it's for
Integrations
Works with the tools you already use.
Payments, database, AI, email and analytics, wired up the moment you connect.










04 / Why generate it
Mixpanel and Amplitude charge $400+/month at scale. PostHog is great but per-event pricing kicks in fast. With your own events in Postgres, you eliminate the analytics SaaS line item entirely.
Your events are the most important data your product produces. Owning the queries means you can ask new questions without filing a ticket with the analytics vendor or learning their DSL.
Everything you need to know before you generate it. Anything else, our team is one email away.
Two patterns. From your client/server: POST events to a /track endpoint that writes to a Postgres events table. From PostHog/Mixpanel: use their export API (PostHog has a Postgres-compatible warehouse export, Mixpanel exports to S3). WebTwizz scaffolds either.
Postgres handles tens of millions of events comfortably with proper indexing. Past 100M events, move events to ClickHouse (WebTwizz can scaffold the migration), it's built for analytics queries and stays cheap at scale.
A cohort is users grouped by a shared trait (signup week, plan, source). Retention is the % of cohort users active in week N after their first action. The dashboard runs SQL on your events table; results are cached for 5-15 minutes so the page loads fast.
Yes. Add Supabase auth with roles. PMs see the product funnel, marketing sees the acquisition funnel, exec sees the high-level KPIs. Same database, different rendered dashboards. No per-seat fees because everyone's on your auth.
Keep building
Describe what you want. WebTwizz builds the real thing, then you click to change anything. No code needed.
Get started for free, no credit card needed.