Data
Wire up real data
Databases and CMS that power your live app, no backend to set up.
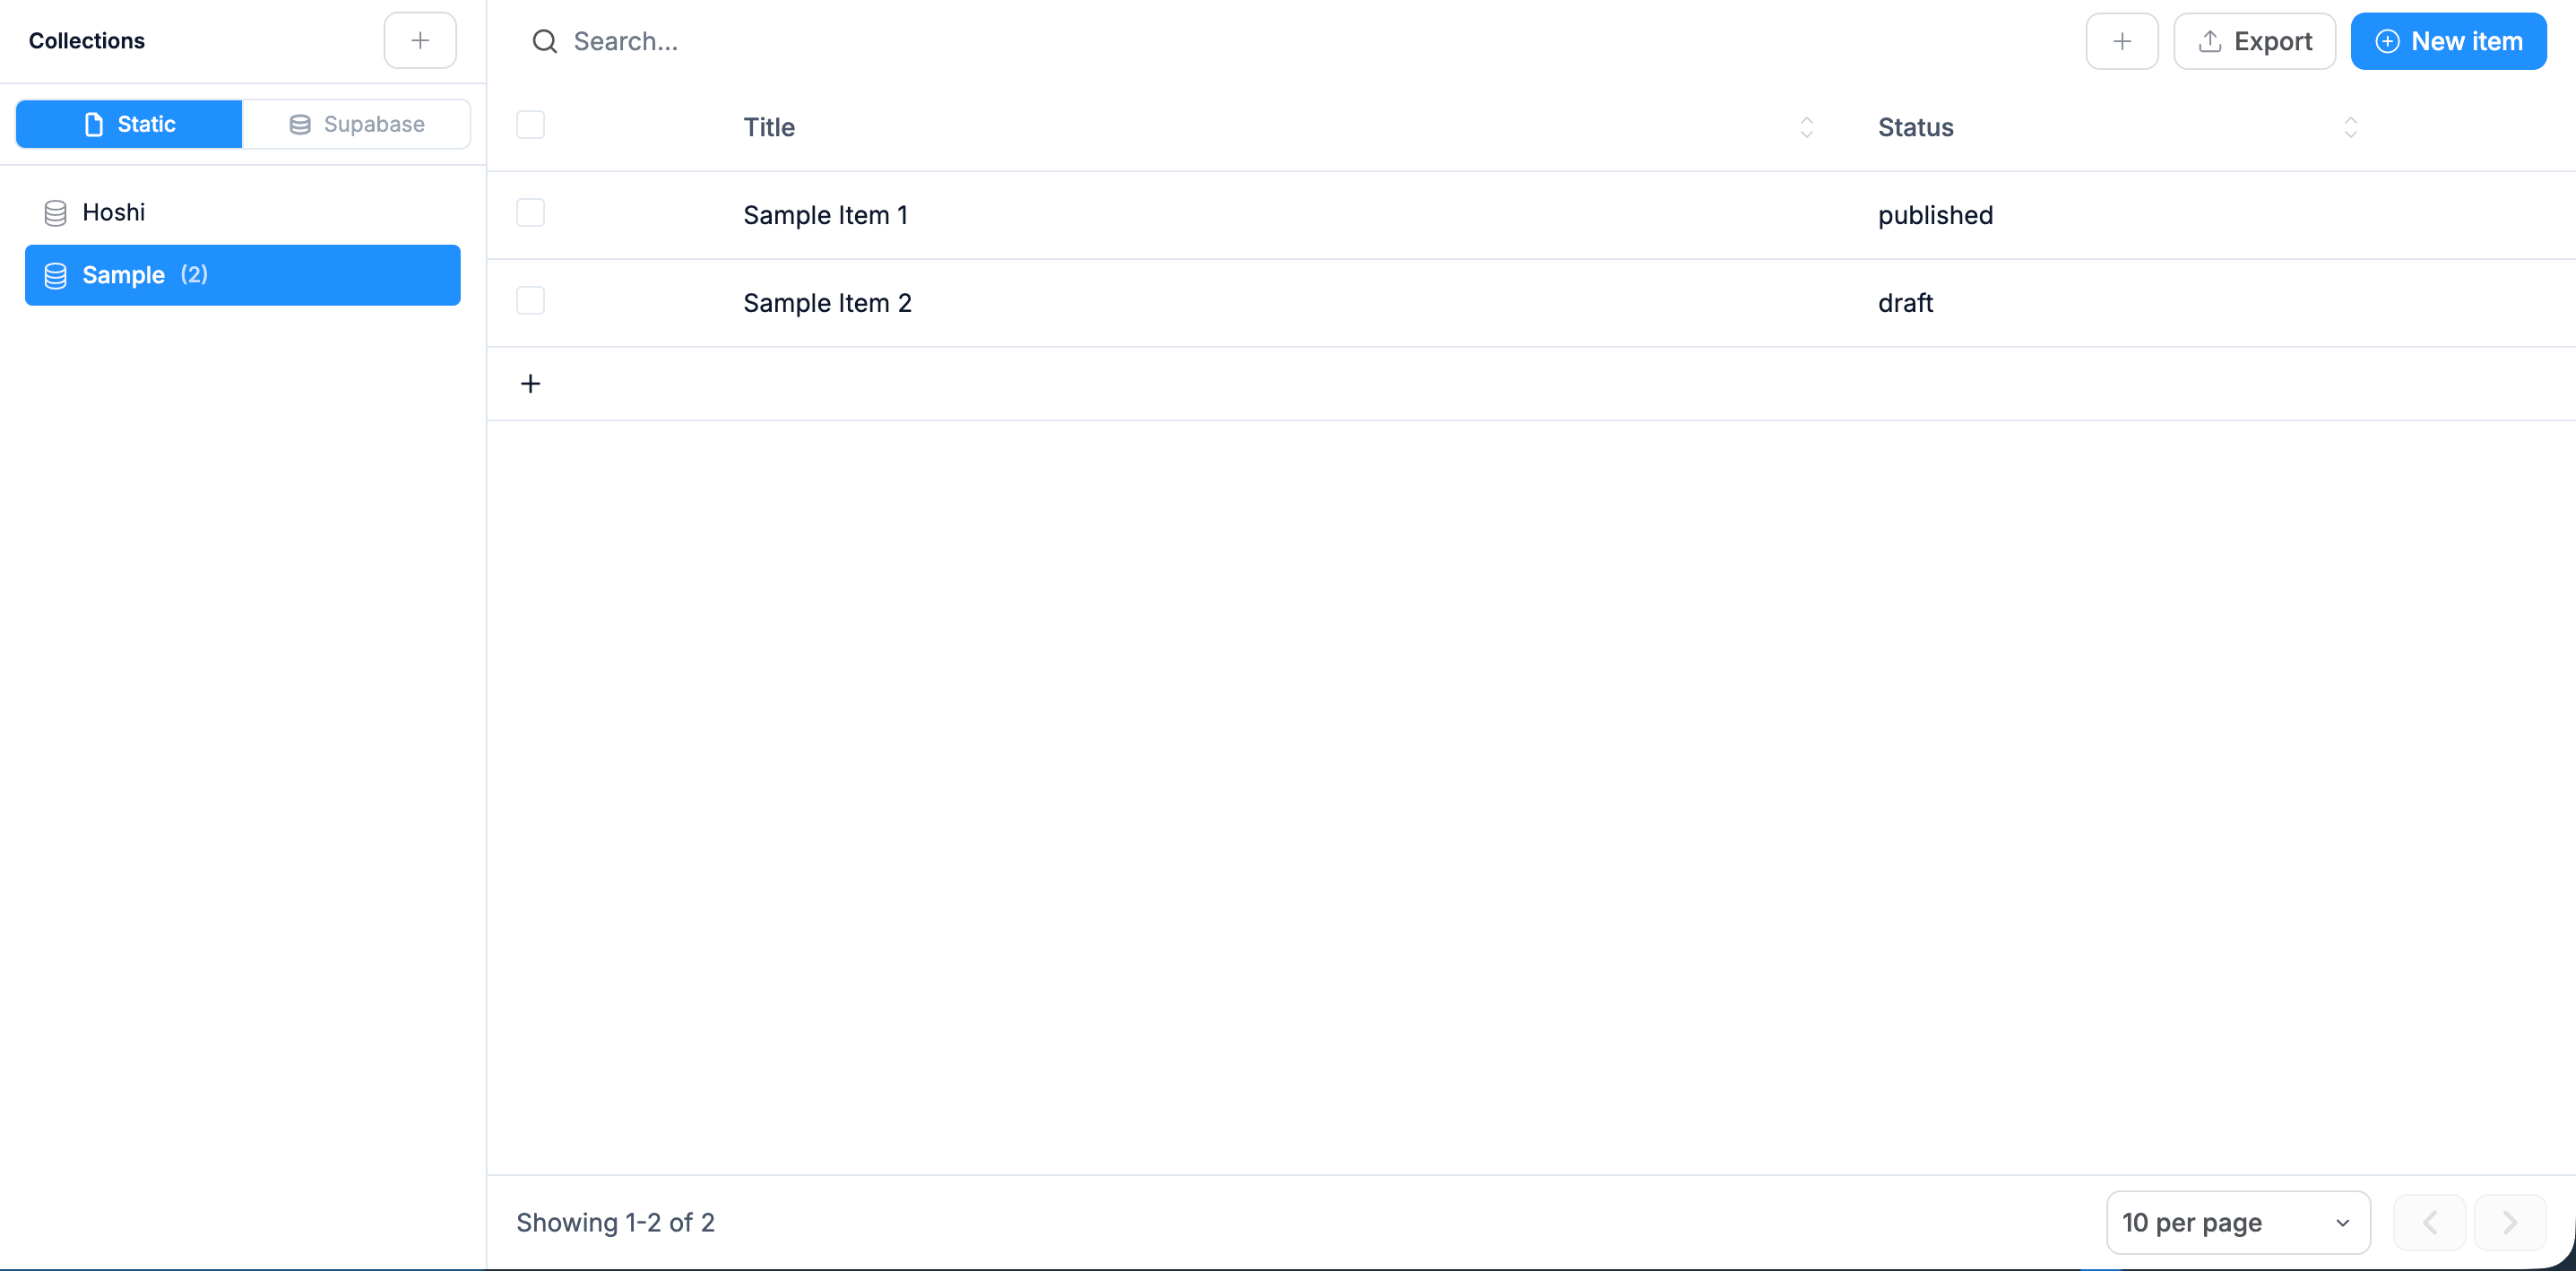
One screen for the daily standup. No tab juggling, no spreadsheet sync, no waiting for the BI team to update the report.
01 / What you get
Click Generate from the box above. Real code, a real database, real integrations, not a sandbox. Each piece below ships in the first prompt.
Inventory levels with low-stock alerts and reorder thresholds
Orders queue grouped by fulfilment status (new, processing, shipped, delayed)
Per-team-member load: open tickets / orders / tasks assigned
Support SLA tracker: time to first response, time to resolve, breach alerts
Weekly volume chart per metric so trends are visible without exporting
Custom views per role: ops manager sees one thing, fulfilment sees another
02 / Variants
Databases and CMS that power your live app, no backend to set up.
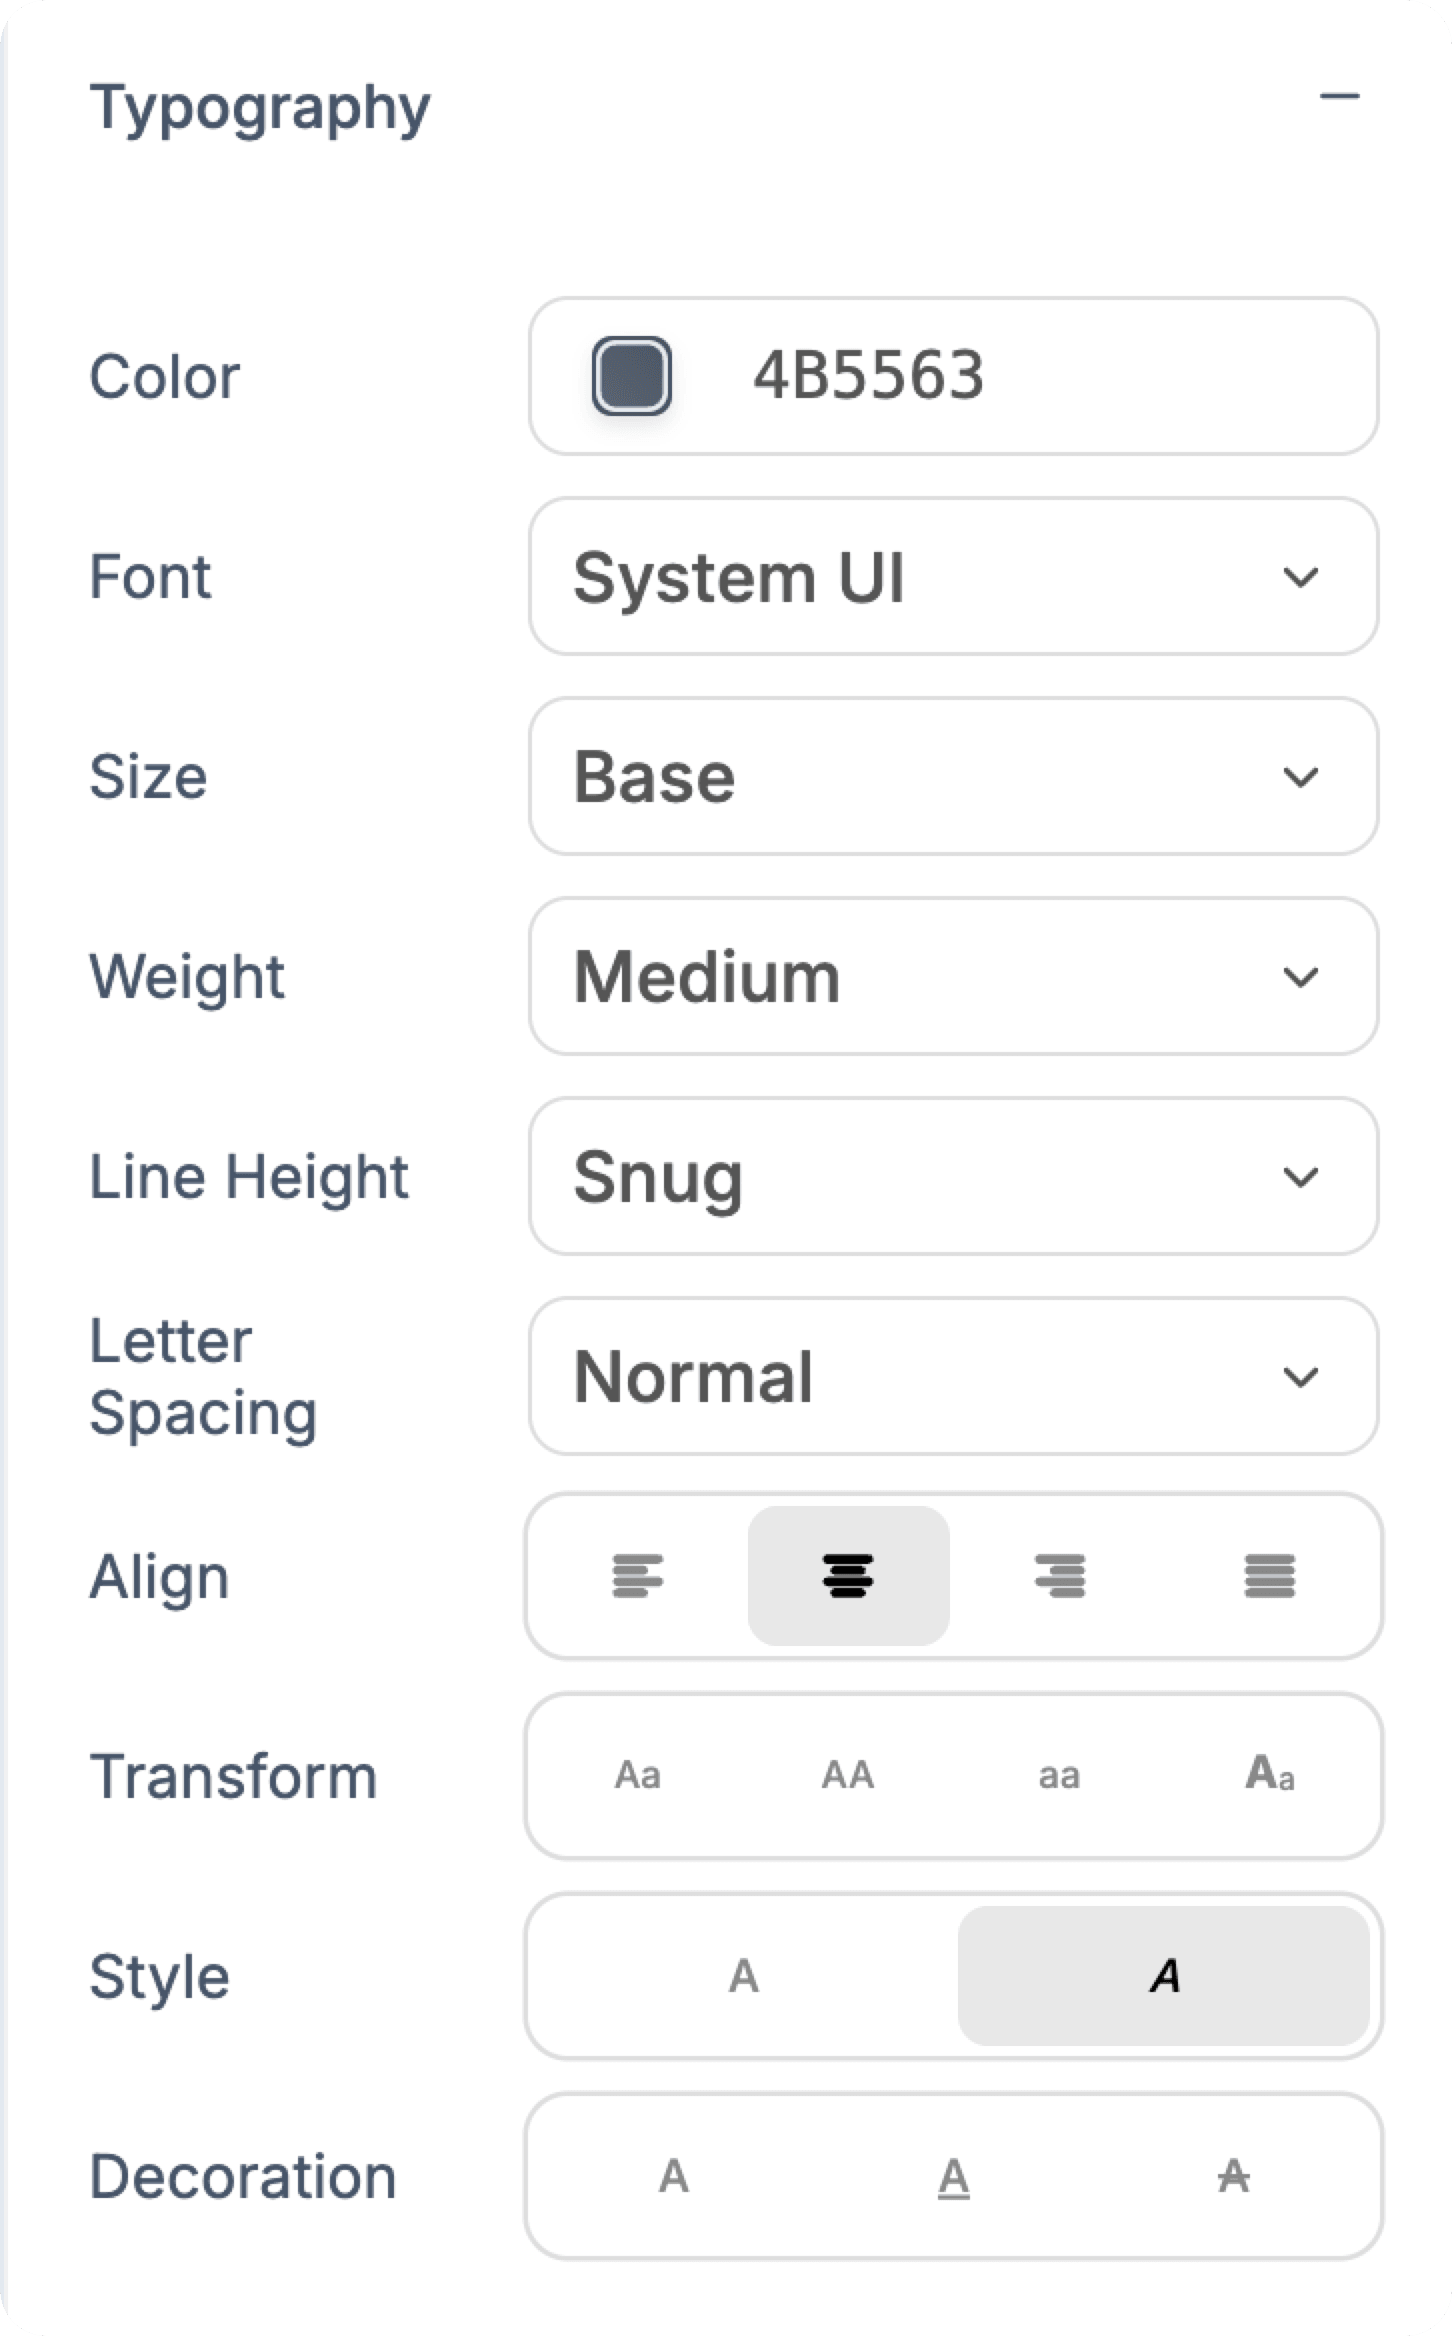
Font, size, weight, leading and spacing, all by hand.
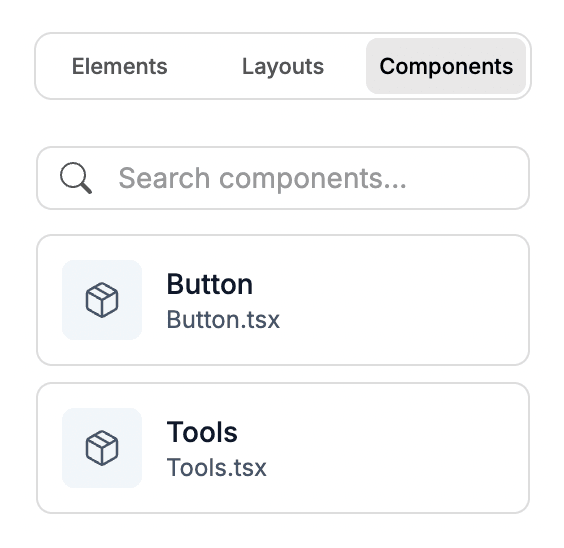
Save any section and drop it in anywhere.
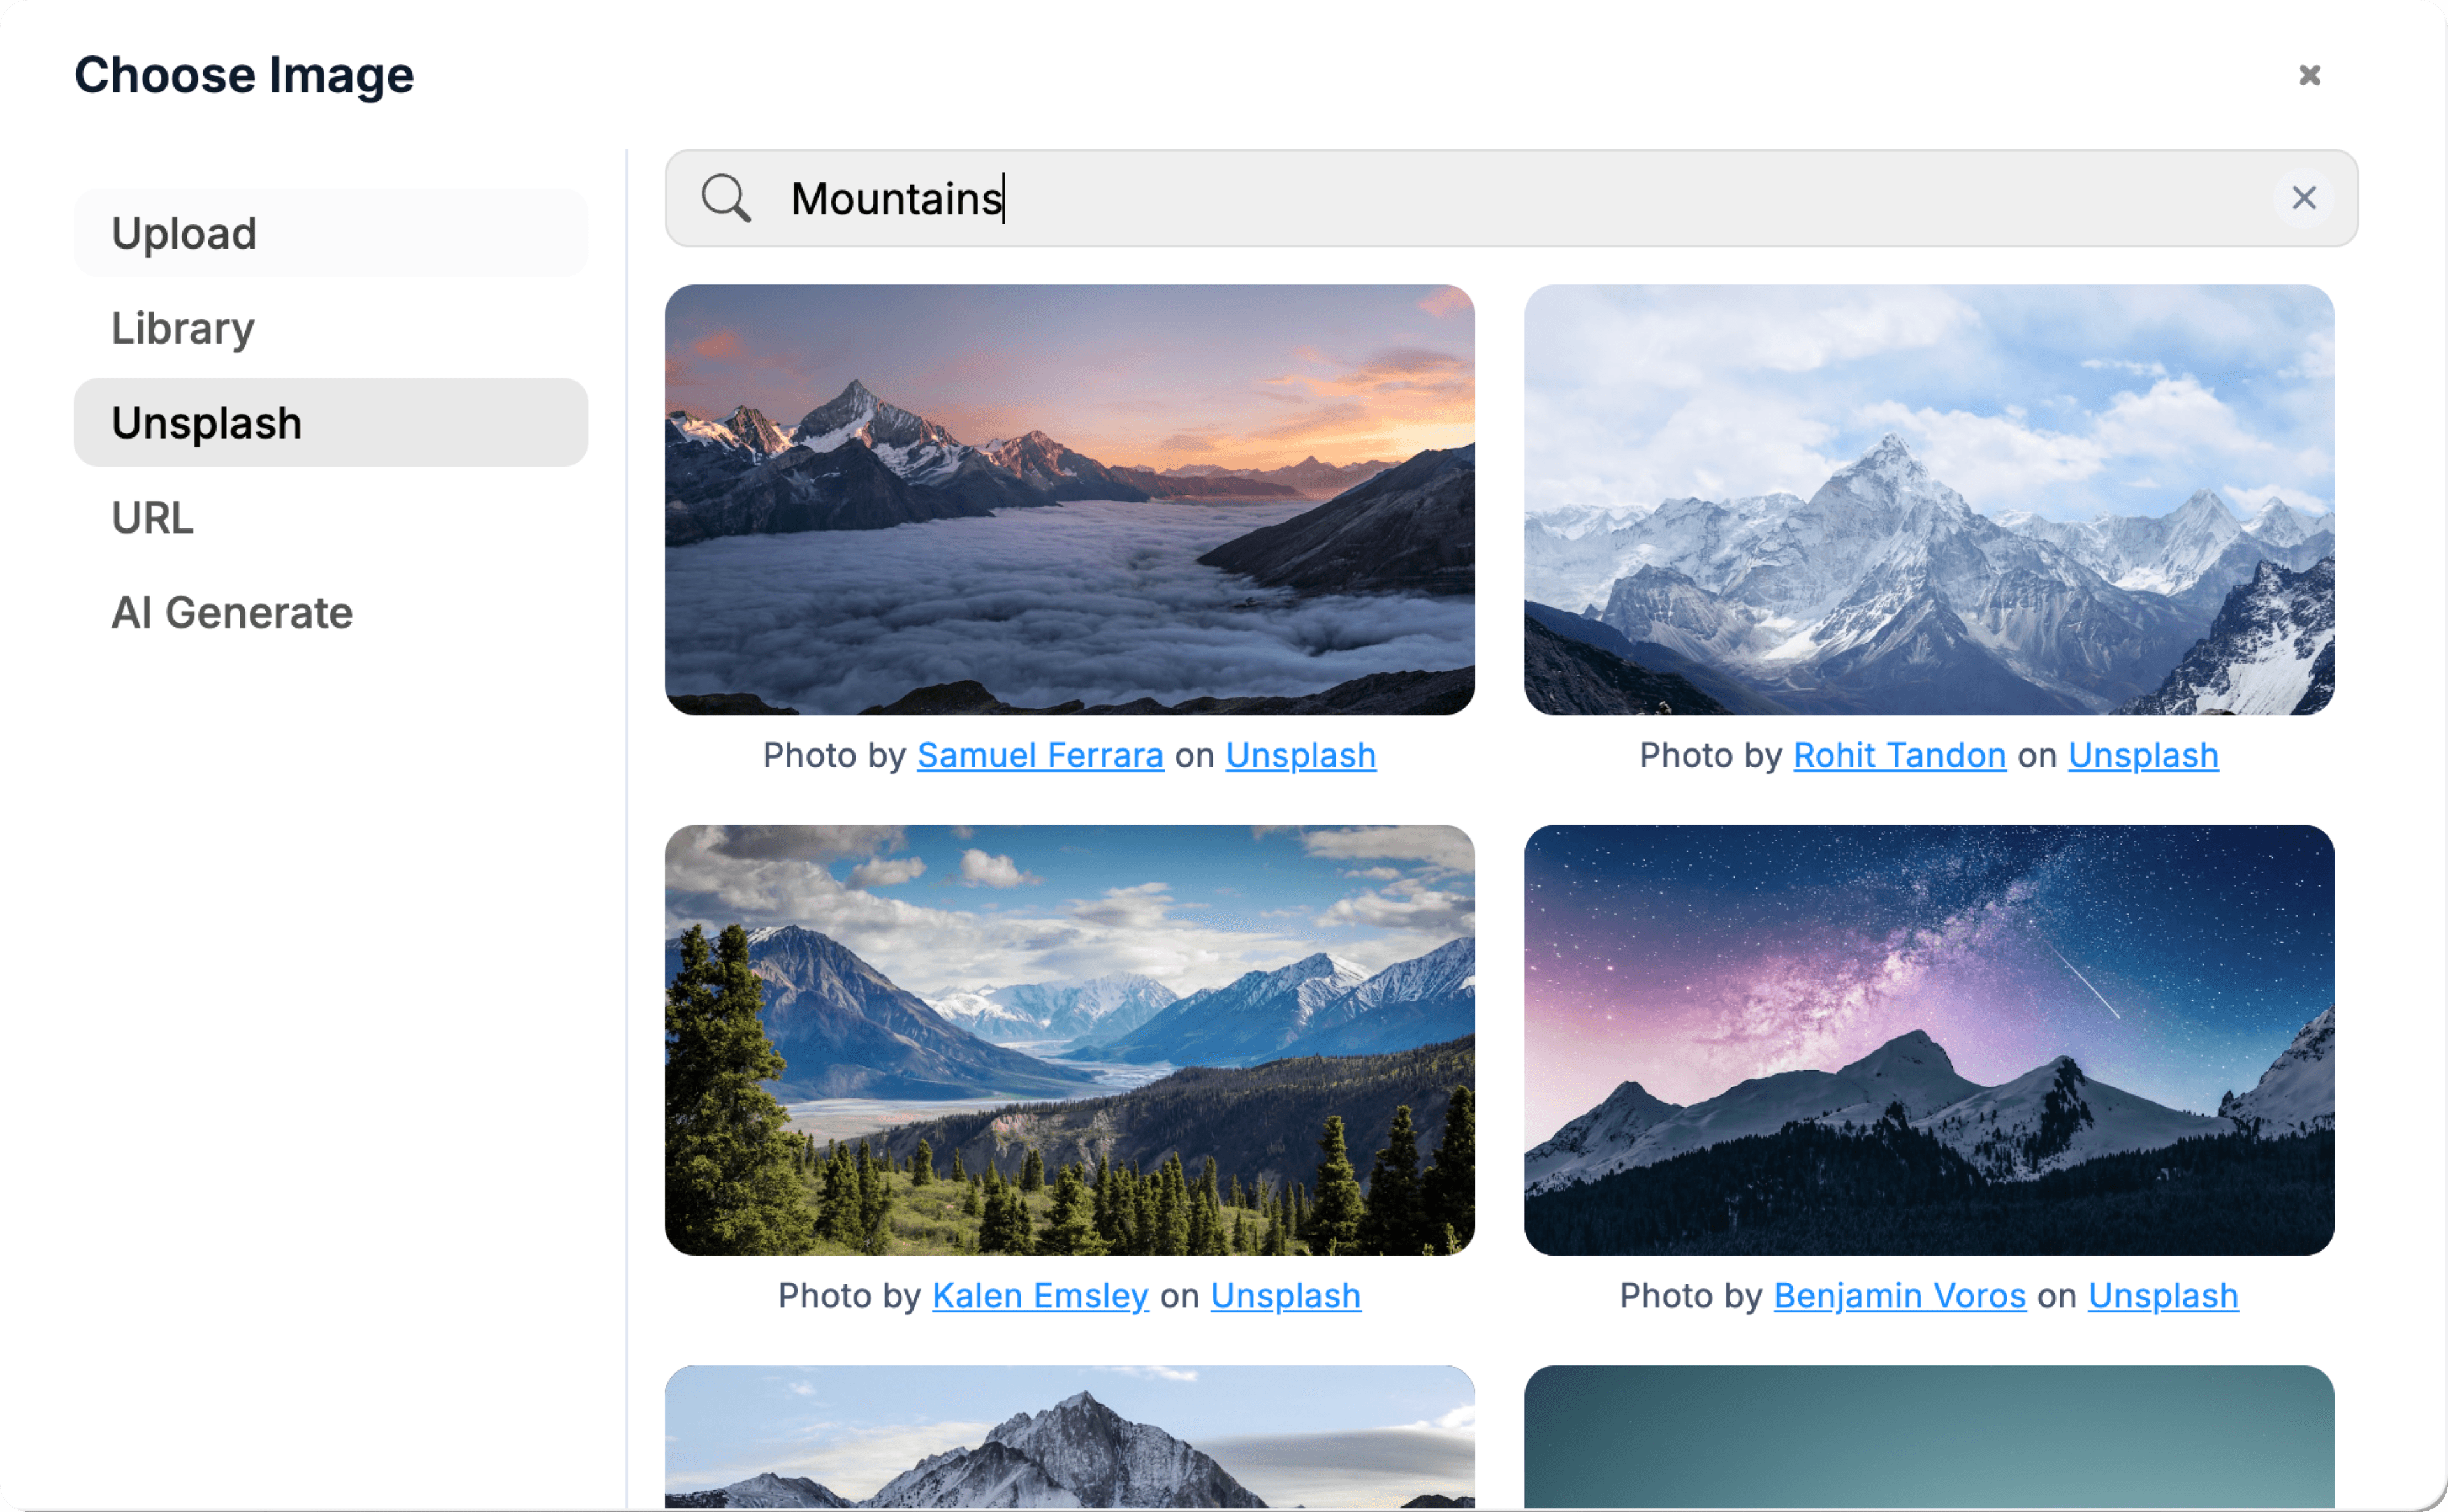
Pull in free imagery without leaving the canvas.
03 / Who it's for
Integrations
Works with the tools you already use.
Payments, database, AI, email and analytics, wired up the moment you connect.










04 / Why generate it
Tableau, Looker, Power BI all need a BI engineer to maintain. Internal-tool builders like Retool charge per seat. Generate exactly the views your team needs, change them by prompting, no BI ticket queue.
You own the queries and the data. Switch your warehouse from BigQuery to Postgres next year? Update one connection string, the dashboard keeps running.
Everything you need to know before you generate it. Anything else, our team is one email away.
Anything with an API or a Postgres connection string. Built-in: Supabase, Stripe, OpenAI, Anthropic. Add others by giving the AI an API key and asking it to wire the integration. For warehouses (BigQuery, Snowflake, Redshift), expose a Postgres-compatible read replica or a query API.
Yes. Add Supabase auth with a role field on each user. The dashboard reads the role and shows the matching layout. Ops manager sees overview + drill-downs; fulfilment sees the order queue only; support sees their tickets and SLA. One codebase, role-based rendering.
Two patterns. Polling (refresh every N seconds for low-volume dashboards) is the default. For real-time, use Supabase realtime subscriptions or Postgres LISTEN/NOTIFY, the AI scaffolds either based on the prompt. Dashboards under 50 viewers can poll cheaply; high-traffic ones should use realtime.
Yes. Add a thresholds table per metric (low-stock count > 5, SLA breach minutes > 30) and a scheduled function that checks every N minutes. When tripped, send via Resend (email) or Slack incoming webhook. WebTwizz scaffolds the cron and the alert logic from one prompt.
Add a separate route /executive that pulls the same data but renders a stripped-down read-only view. Magic-link auth so execs don't need accounts. For clients (e.g. agency reporting to a brand), scope the data via row-level security so each client sees only their slice.
Keep building
Describe what you want. WebTwizz builds the real thing, then you click to change anything. No code needed.
Get started for free, no credit card needed.