Data
Wire up real data
Databases and CMS that power your live app, no backend to set up.
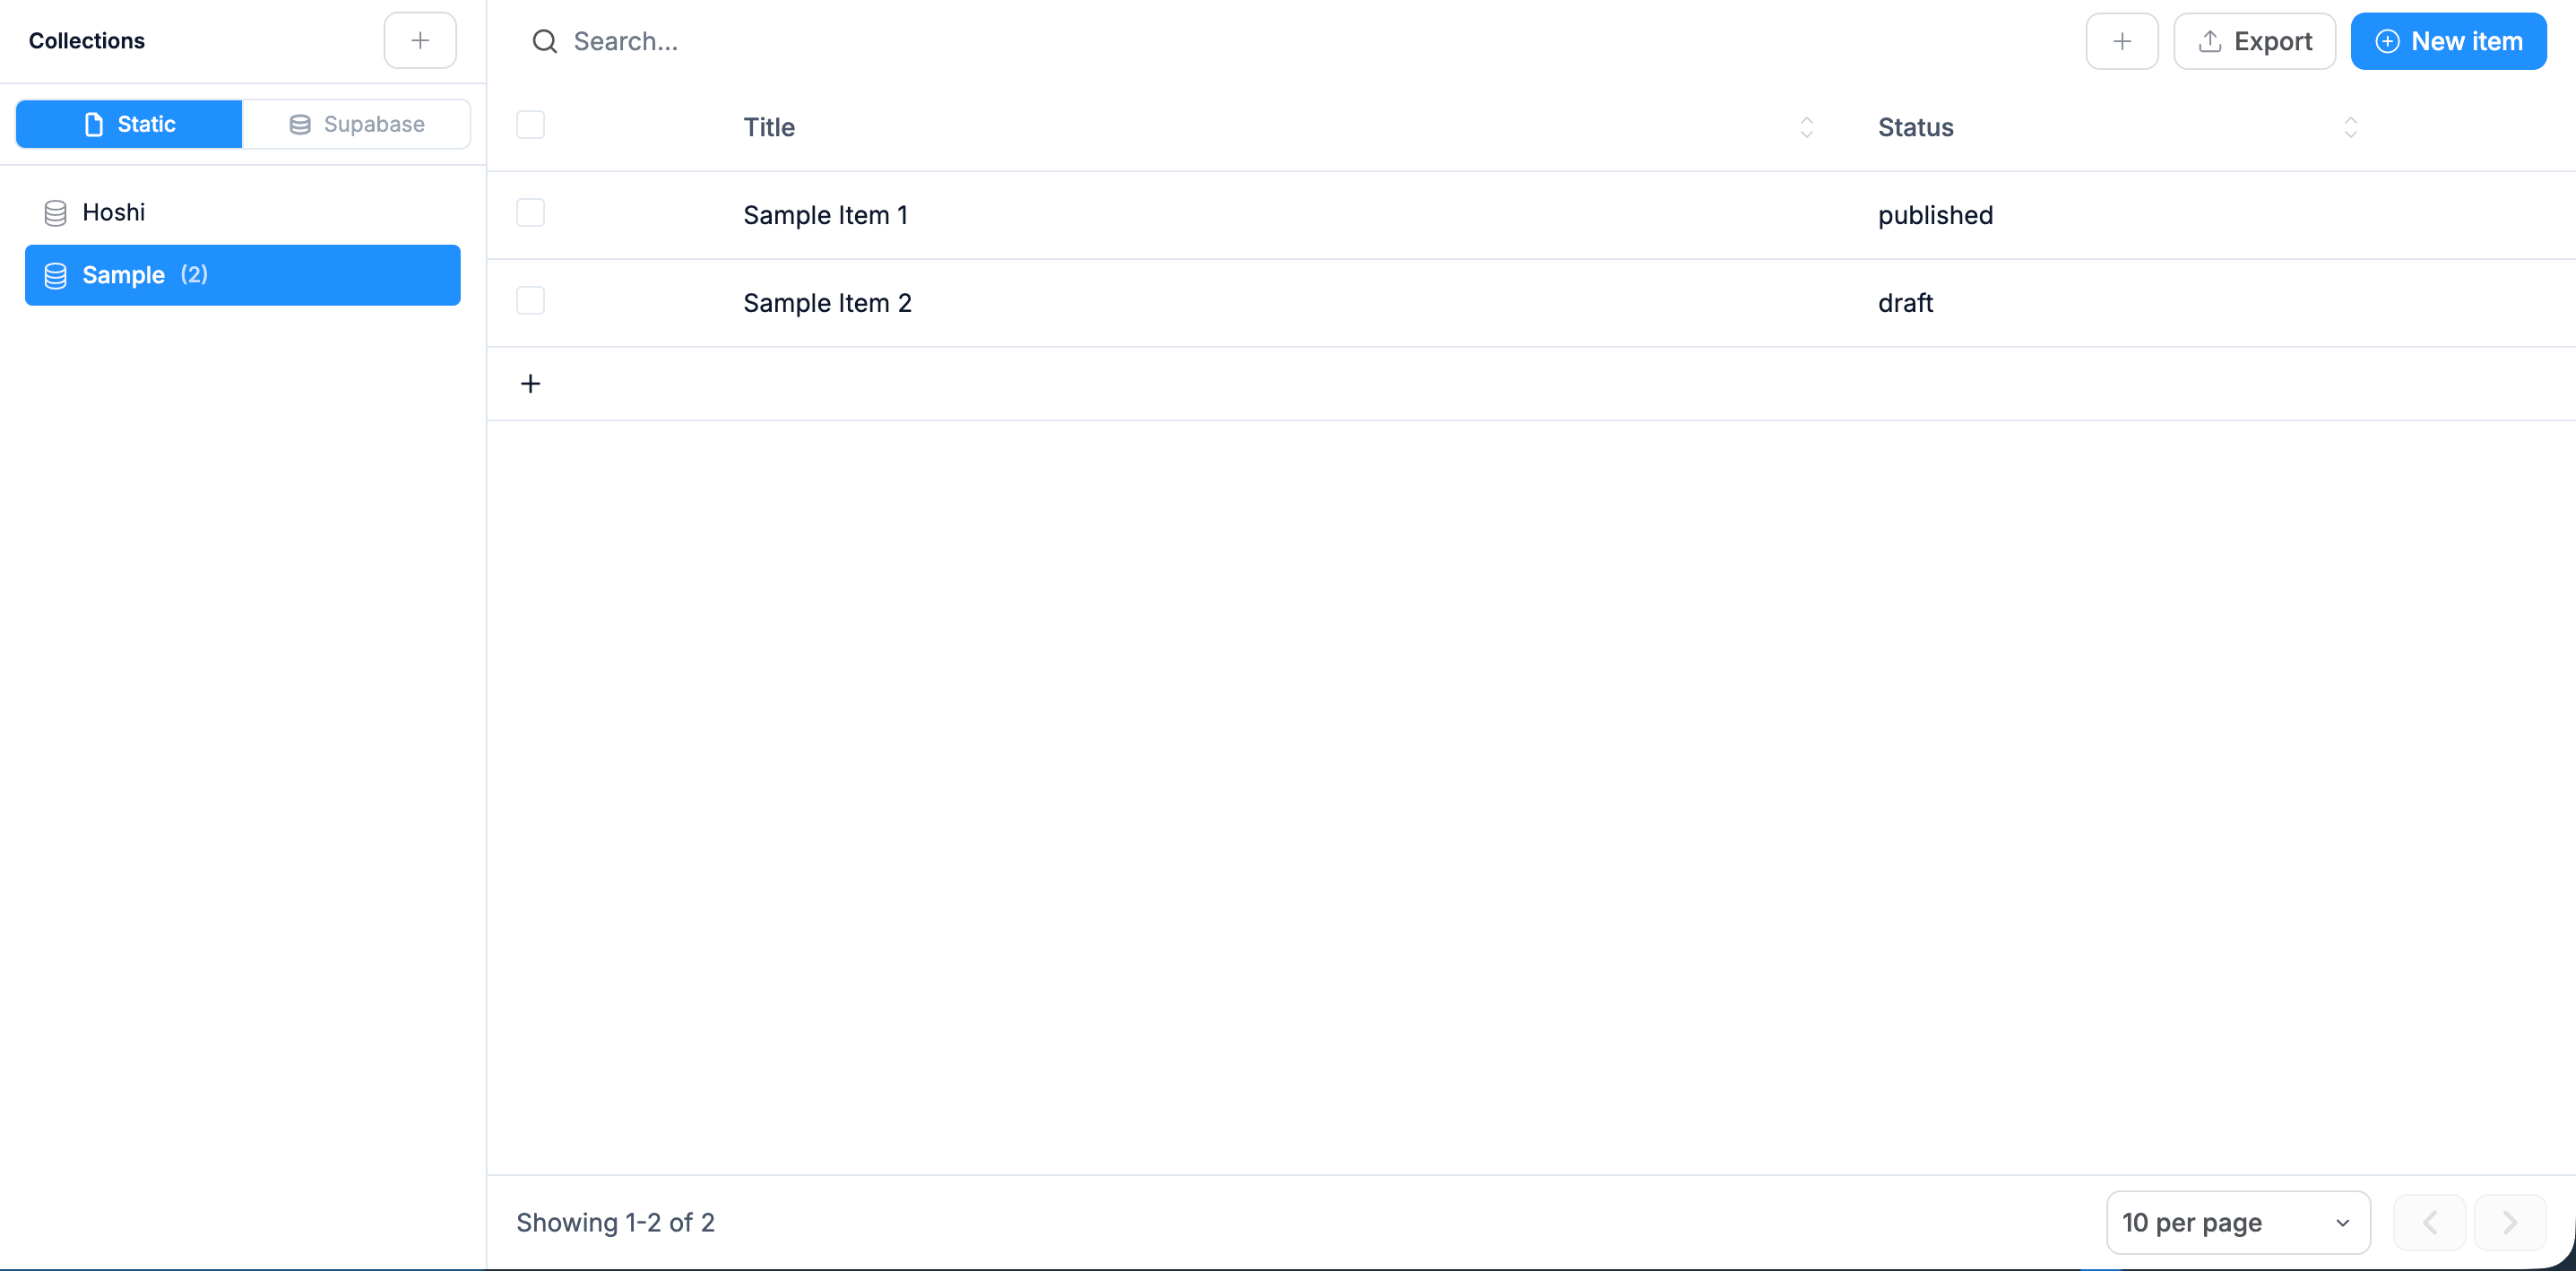
Stop pasting Stripe data into a spreadsheet every Monday. Generate a dashboard that pulls live numbers, computes the metrics you actually care about, and updates itself.
01 / What you get
Click Generate from the box above. Real code, a real database, real integrations, not a sandbox. Each piece below ships in the first prompt.
Live MRR, ARR, and month-over-month growth pulled from Stripe
Churn rate (gross and net) computed from subscription events
Cohort retention chart by signup month
Cash runway calculator: balance, burn, months left to the day
Top customers table sorted by lifetime value or current MRR
Snapshots: nightly cron stores the day's numbers so you can plot trends
02 / Variants
Databases and CMS that power your live app, no backend to set up.
Font, size, weight, leading and spacing, all by hand.


Save any section and drop it in anywhere.
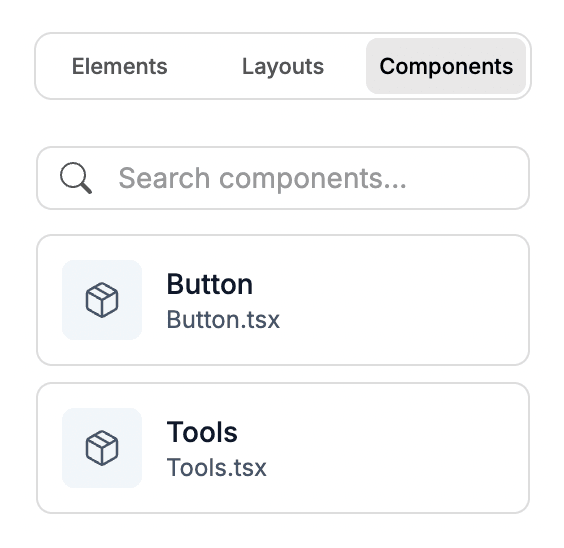
Pull in free imagery without leaving the canvas.


03 / Who it's for
Integrations
Works with the tools you already use.
Payments, database, AI, email and analytics, wired up the moment you connect.










04 / Why generate it
Finance dashboard SaaS (ChartMogul, ProfitWell) starts at $100-$300 a month and locks the metrics you care about behind upgrade tiers. Generate exactly the dashboard you need, no more.
Connect any data source via API. Stripe today, your Postgres tomorrow, your accounting tool next month. You own the integration layer instead of waiting for a vendor to add it.
Everything you need to know before you generate it. Anything else, our team is one email away.
Click the Stripe integration to OAuth into your account. STRIPE_SECRET_KEY lands in your env vars. The AI scaffolds API routes that hit Stripe's subscriptions, invoices, and customer endpoints, computes metrics, and caches results for 5-10 minutes so you don't hammer the API on every page load.
Yes. Add the Supabase integration (or paste a connection string for any Postgres). Tell the AI: "Pull the active_users count from the events table, group by week." It writes the query and the chart together.
Runway = (cash balance) / (monthly burn). Burn = (last 3 months of expenses average). Both inputs can be hand-entered (admin form) or pulled from your bank API (Plaid, GoCardless, regional equivalents). The dashboard shows months remaining to the nearest day.
Yes. Add Supabase auth, gate the dashboard behind login, and give your team read-only access. They see the metrics; they never touch your Stripe API key. Different from sharing your Stripe dashboard, which requires a Stripe seat.
Add a "monthly snapshot" page that renders the current month's metrics as a clean shareable URL. Add a CSV export. For investors specifically, add a magic-link auth flow so they can view the page without creating an account.
Keep building
Describe what you want. WebTwizz builds the real thing, then you click to change anything. No code needed.
Get started for free, no credit card needed.