Data
Wire up real data
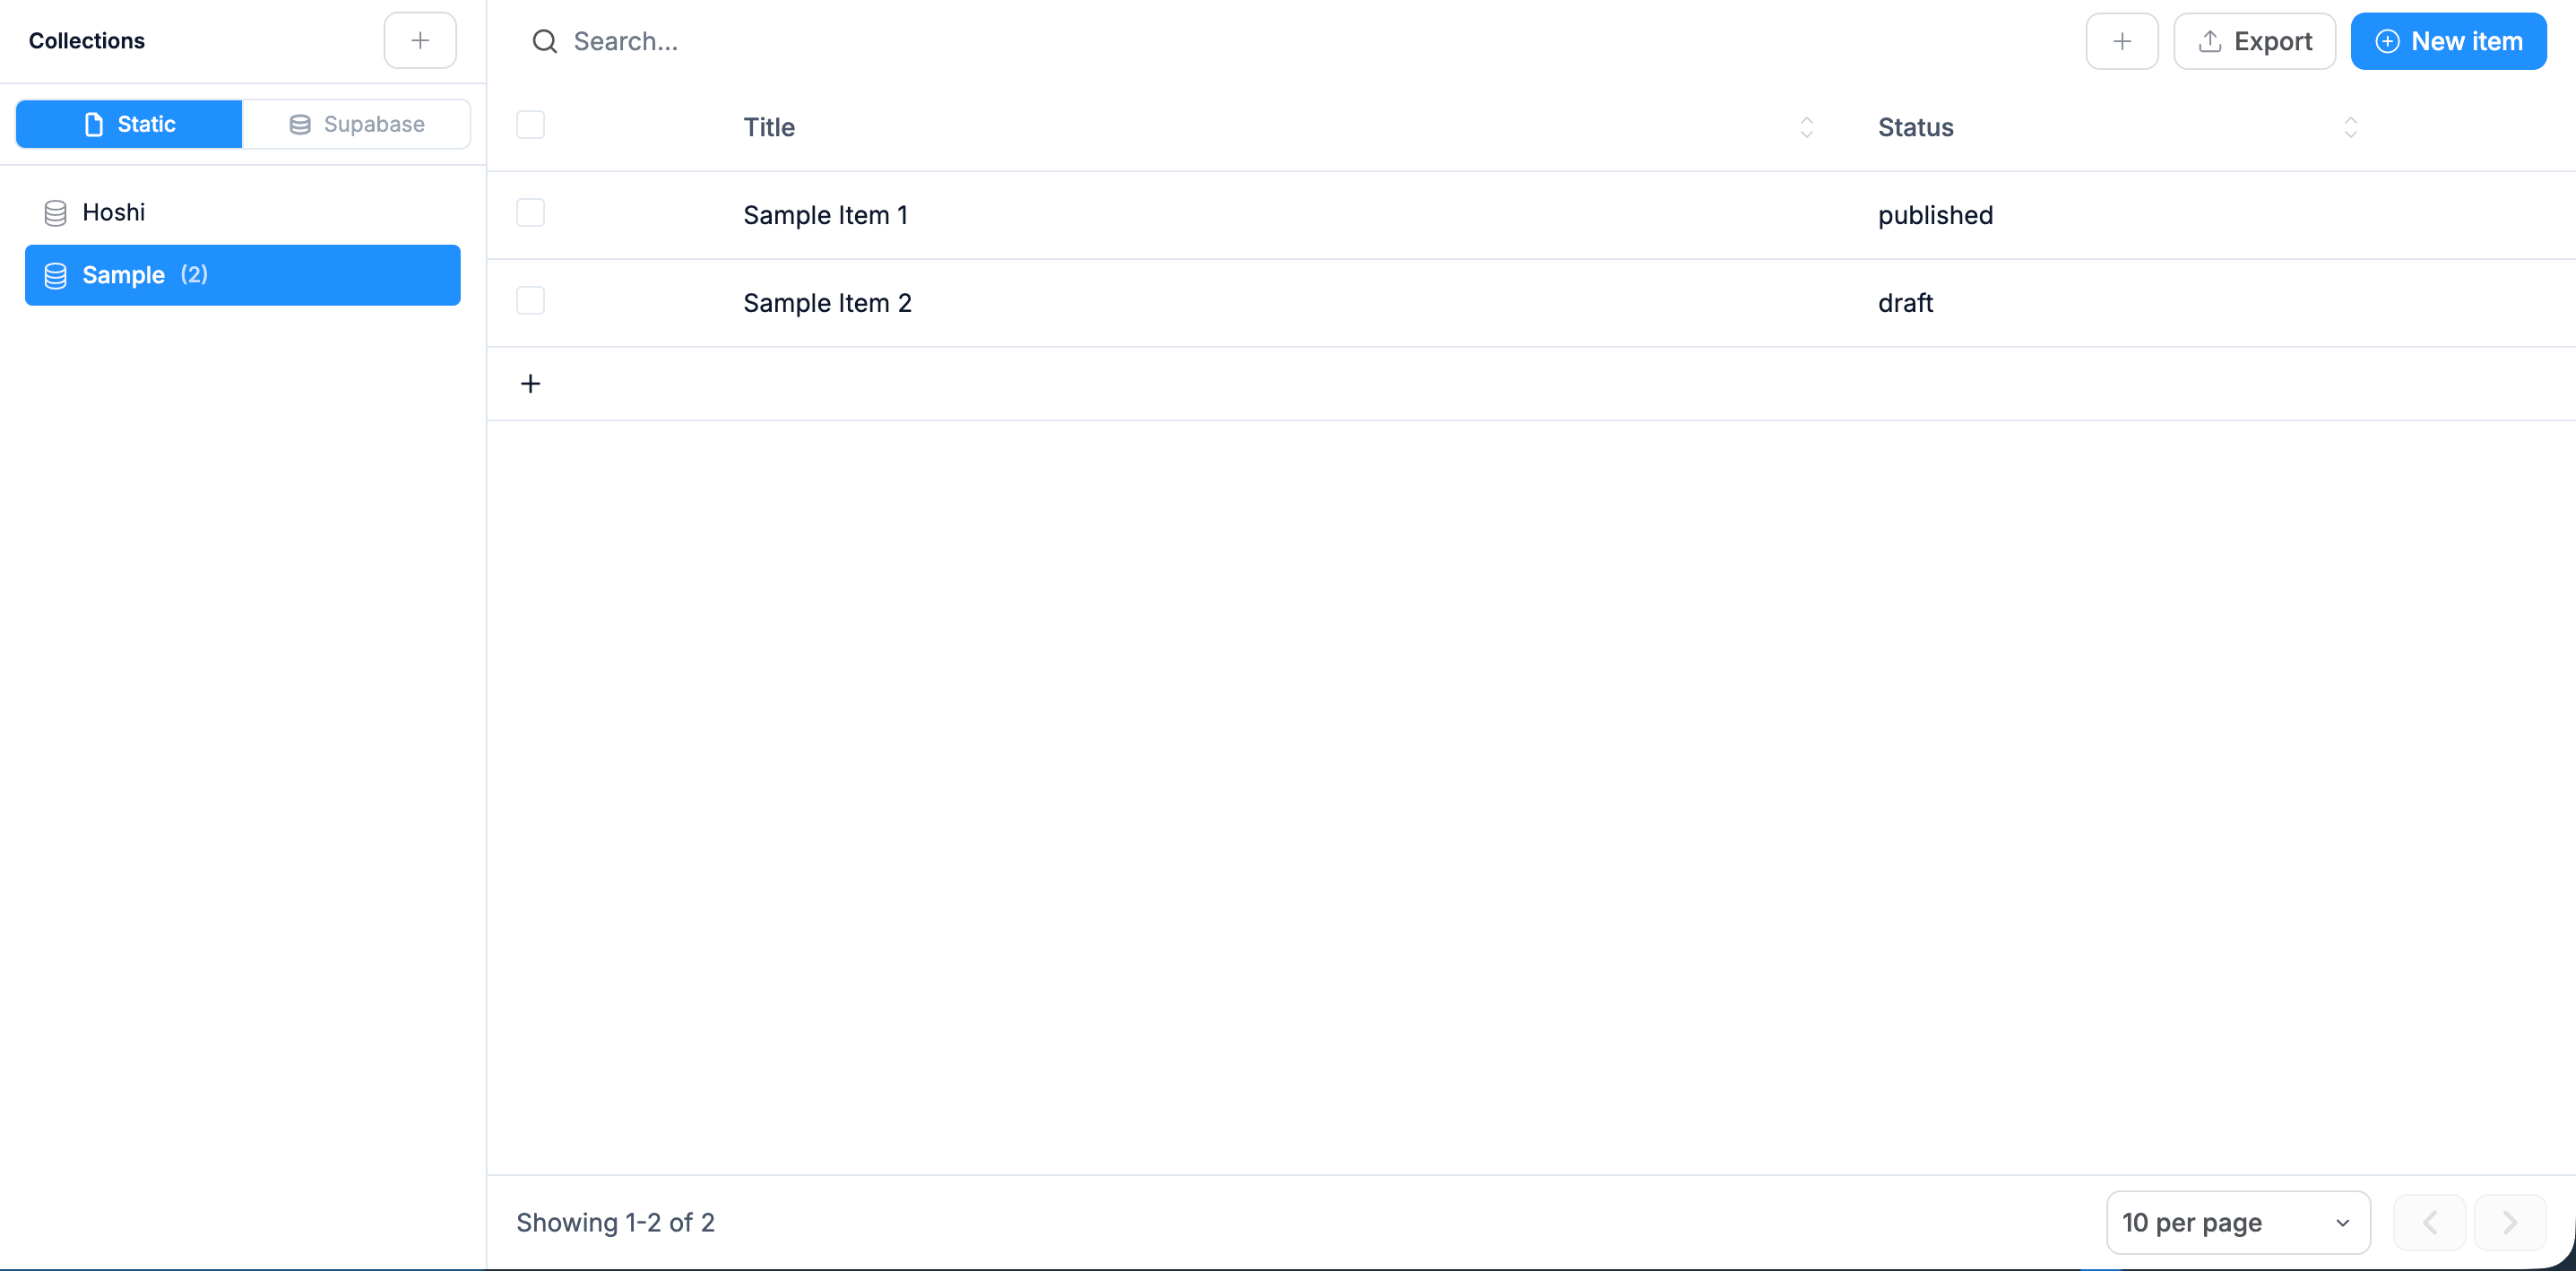
Databases and CMS that power your live app, no backend to set up.
Stock levels, reorder alerts, supplier performance, multi-location. Replace Cin7 / Katana / SOS Inventory at flat infrastructure cost.
01 / What you get
Click Generate from the box above. Real code, a real database, real integrations, not a sandbox. Each piece below ships in the first prompt.
Stock levels per SKU with reorder threshold and lead-time-aware reorder alerts
Multi-location: same SKU stocked at warehouse, store A, store B; transfers tracked
Sales velocity: units sold per day per SKU; auto-flag fast-movers and dead-stock
Supplier performance: lead time variance, defect rate, cost trends
Low-stock heatmap: SKUs that'll run out in N days based on velocity
02 / Variants
Databases and CMS that power your live app, no backend to set up.
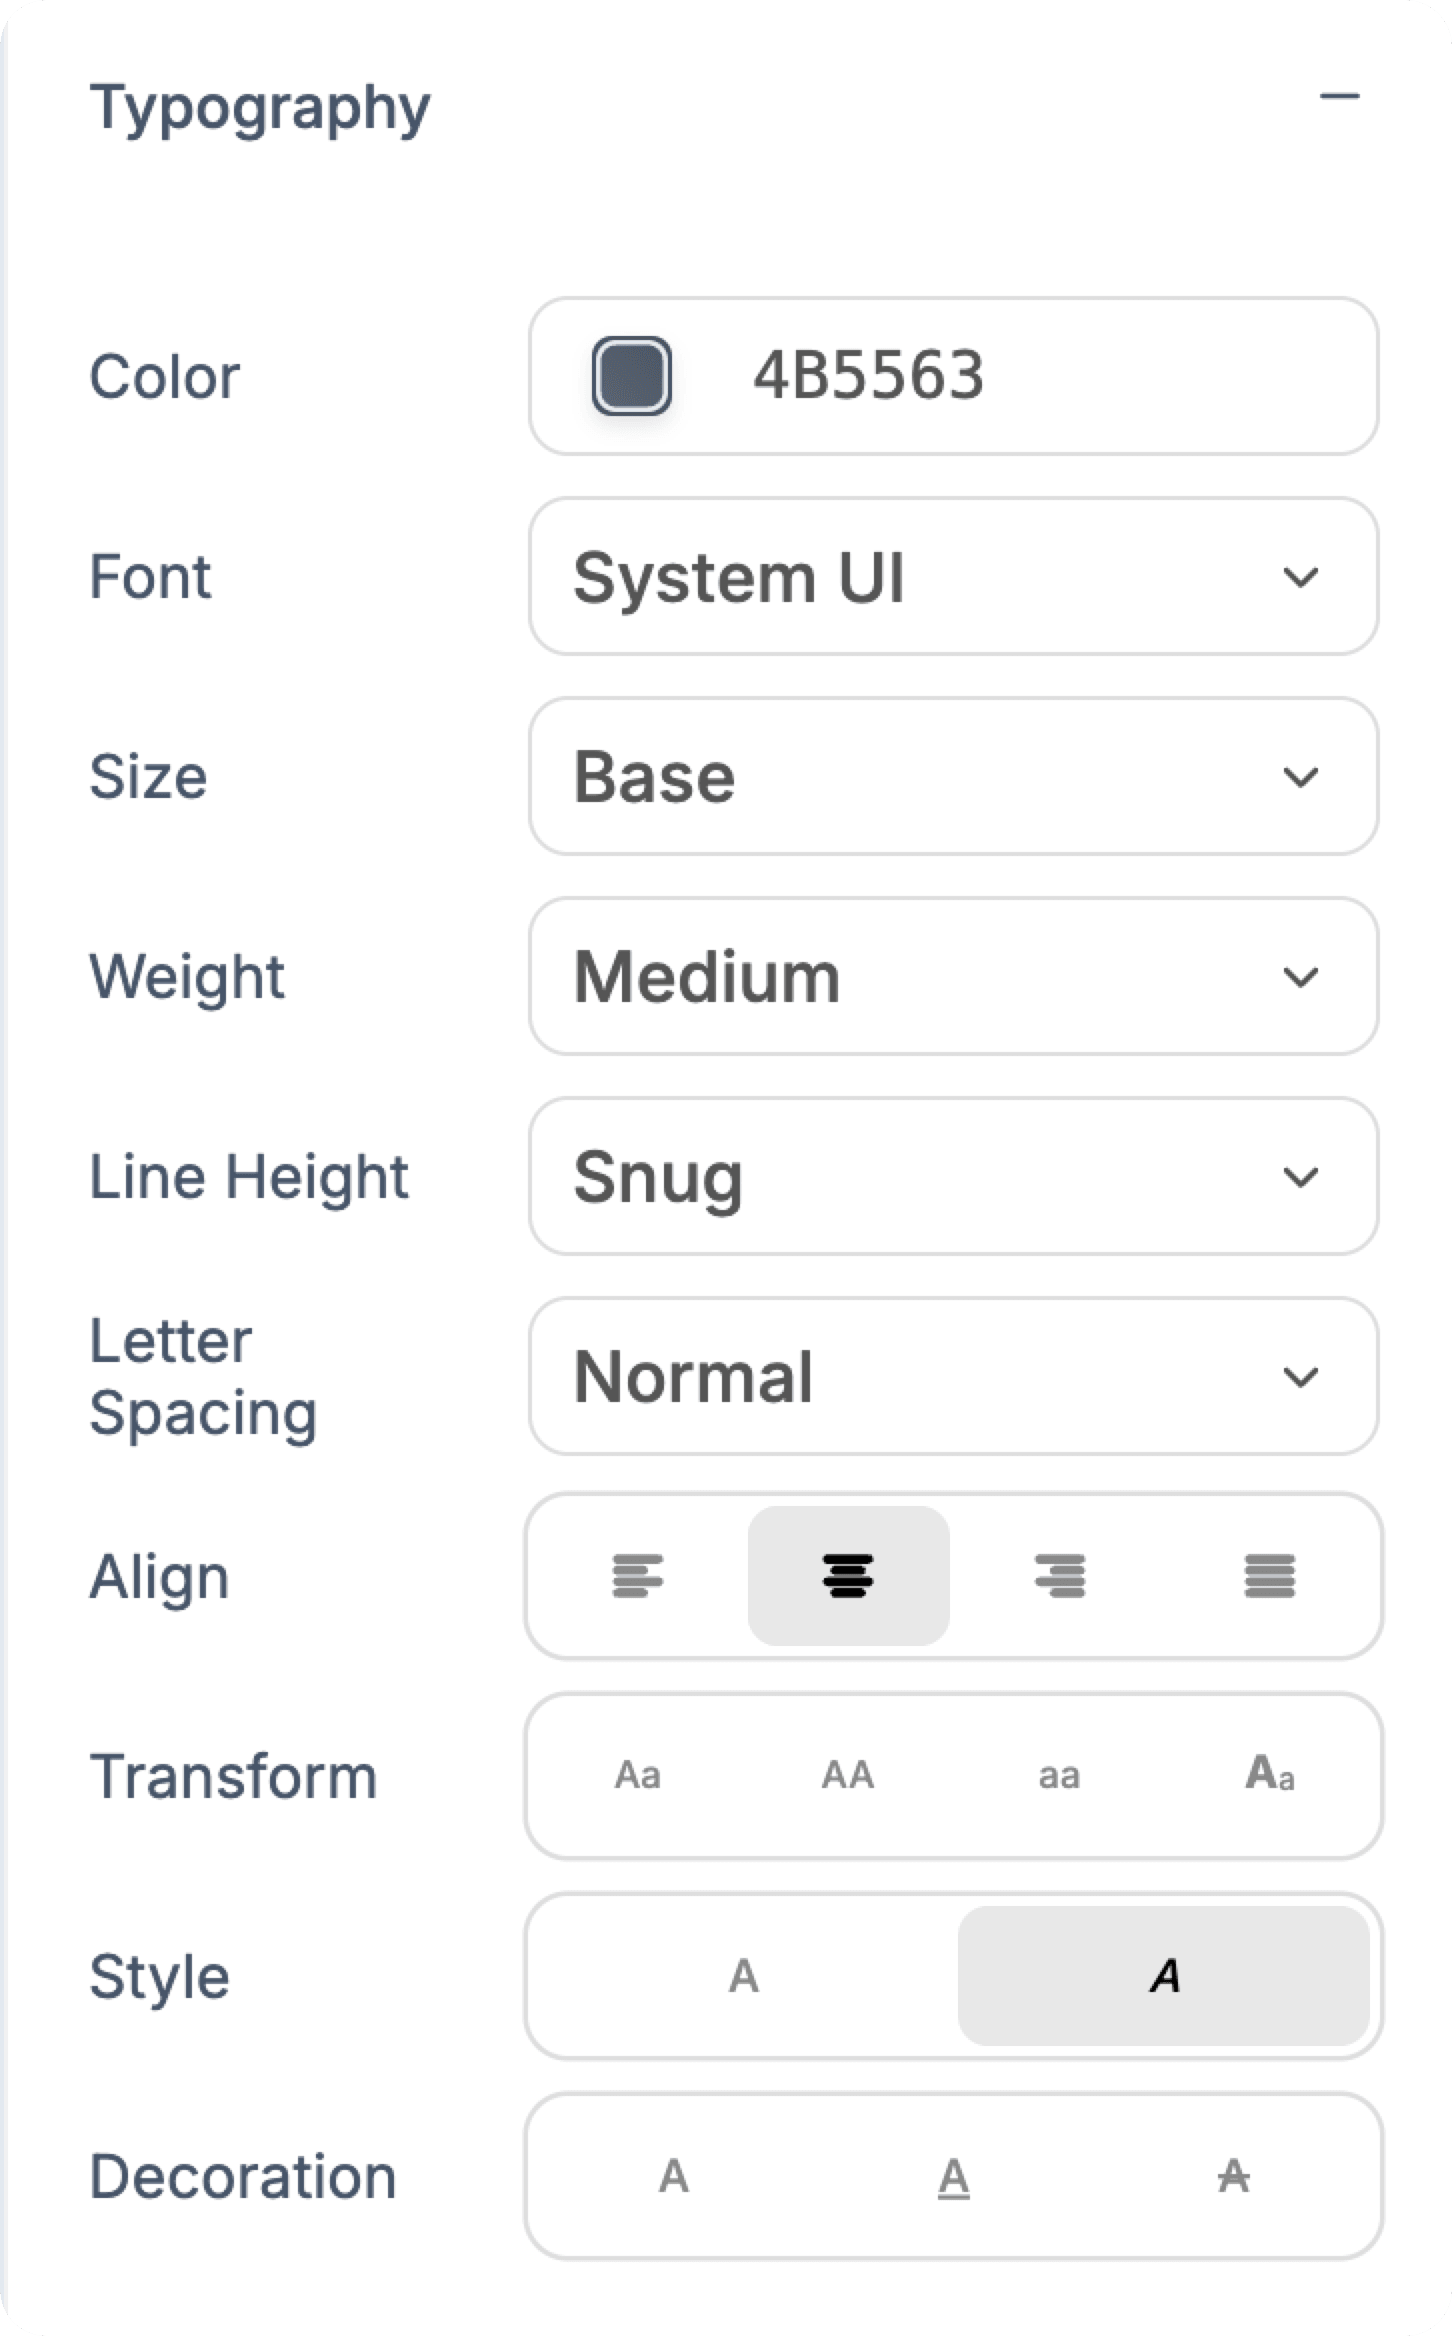
Font, size, weight, leading and spacing, all by hand.
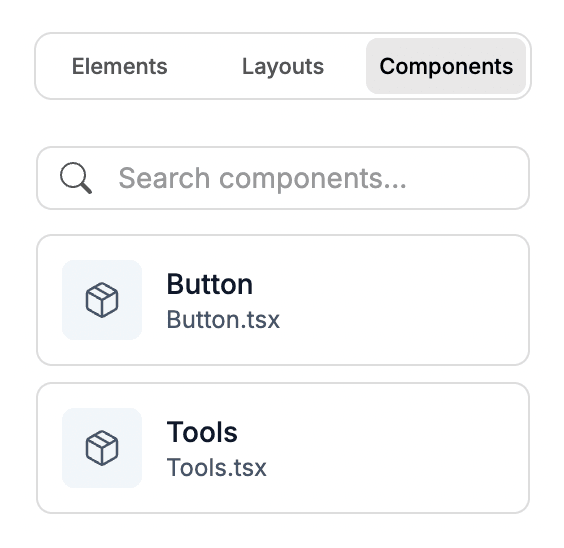
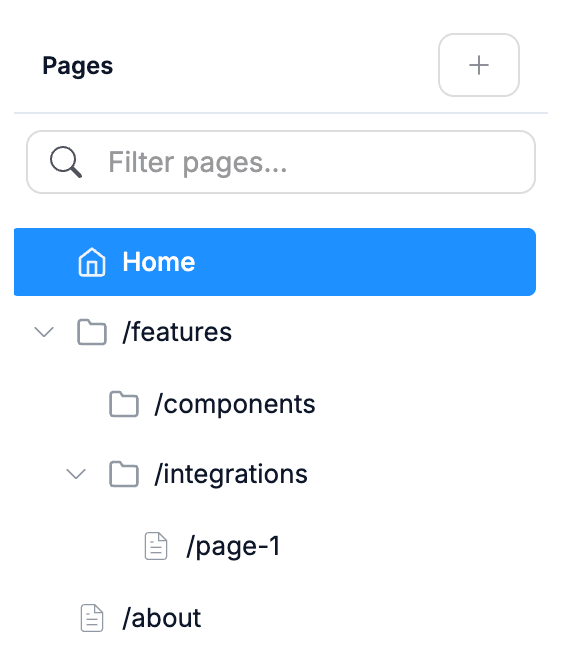
Save any section and drop it in anywhere.
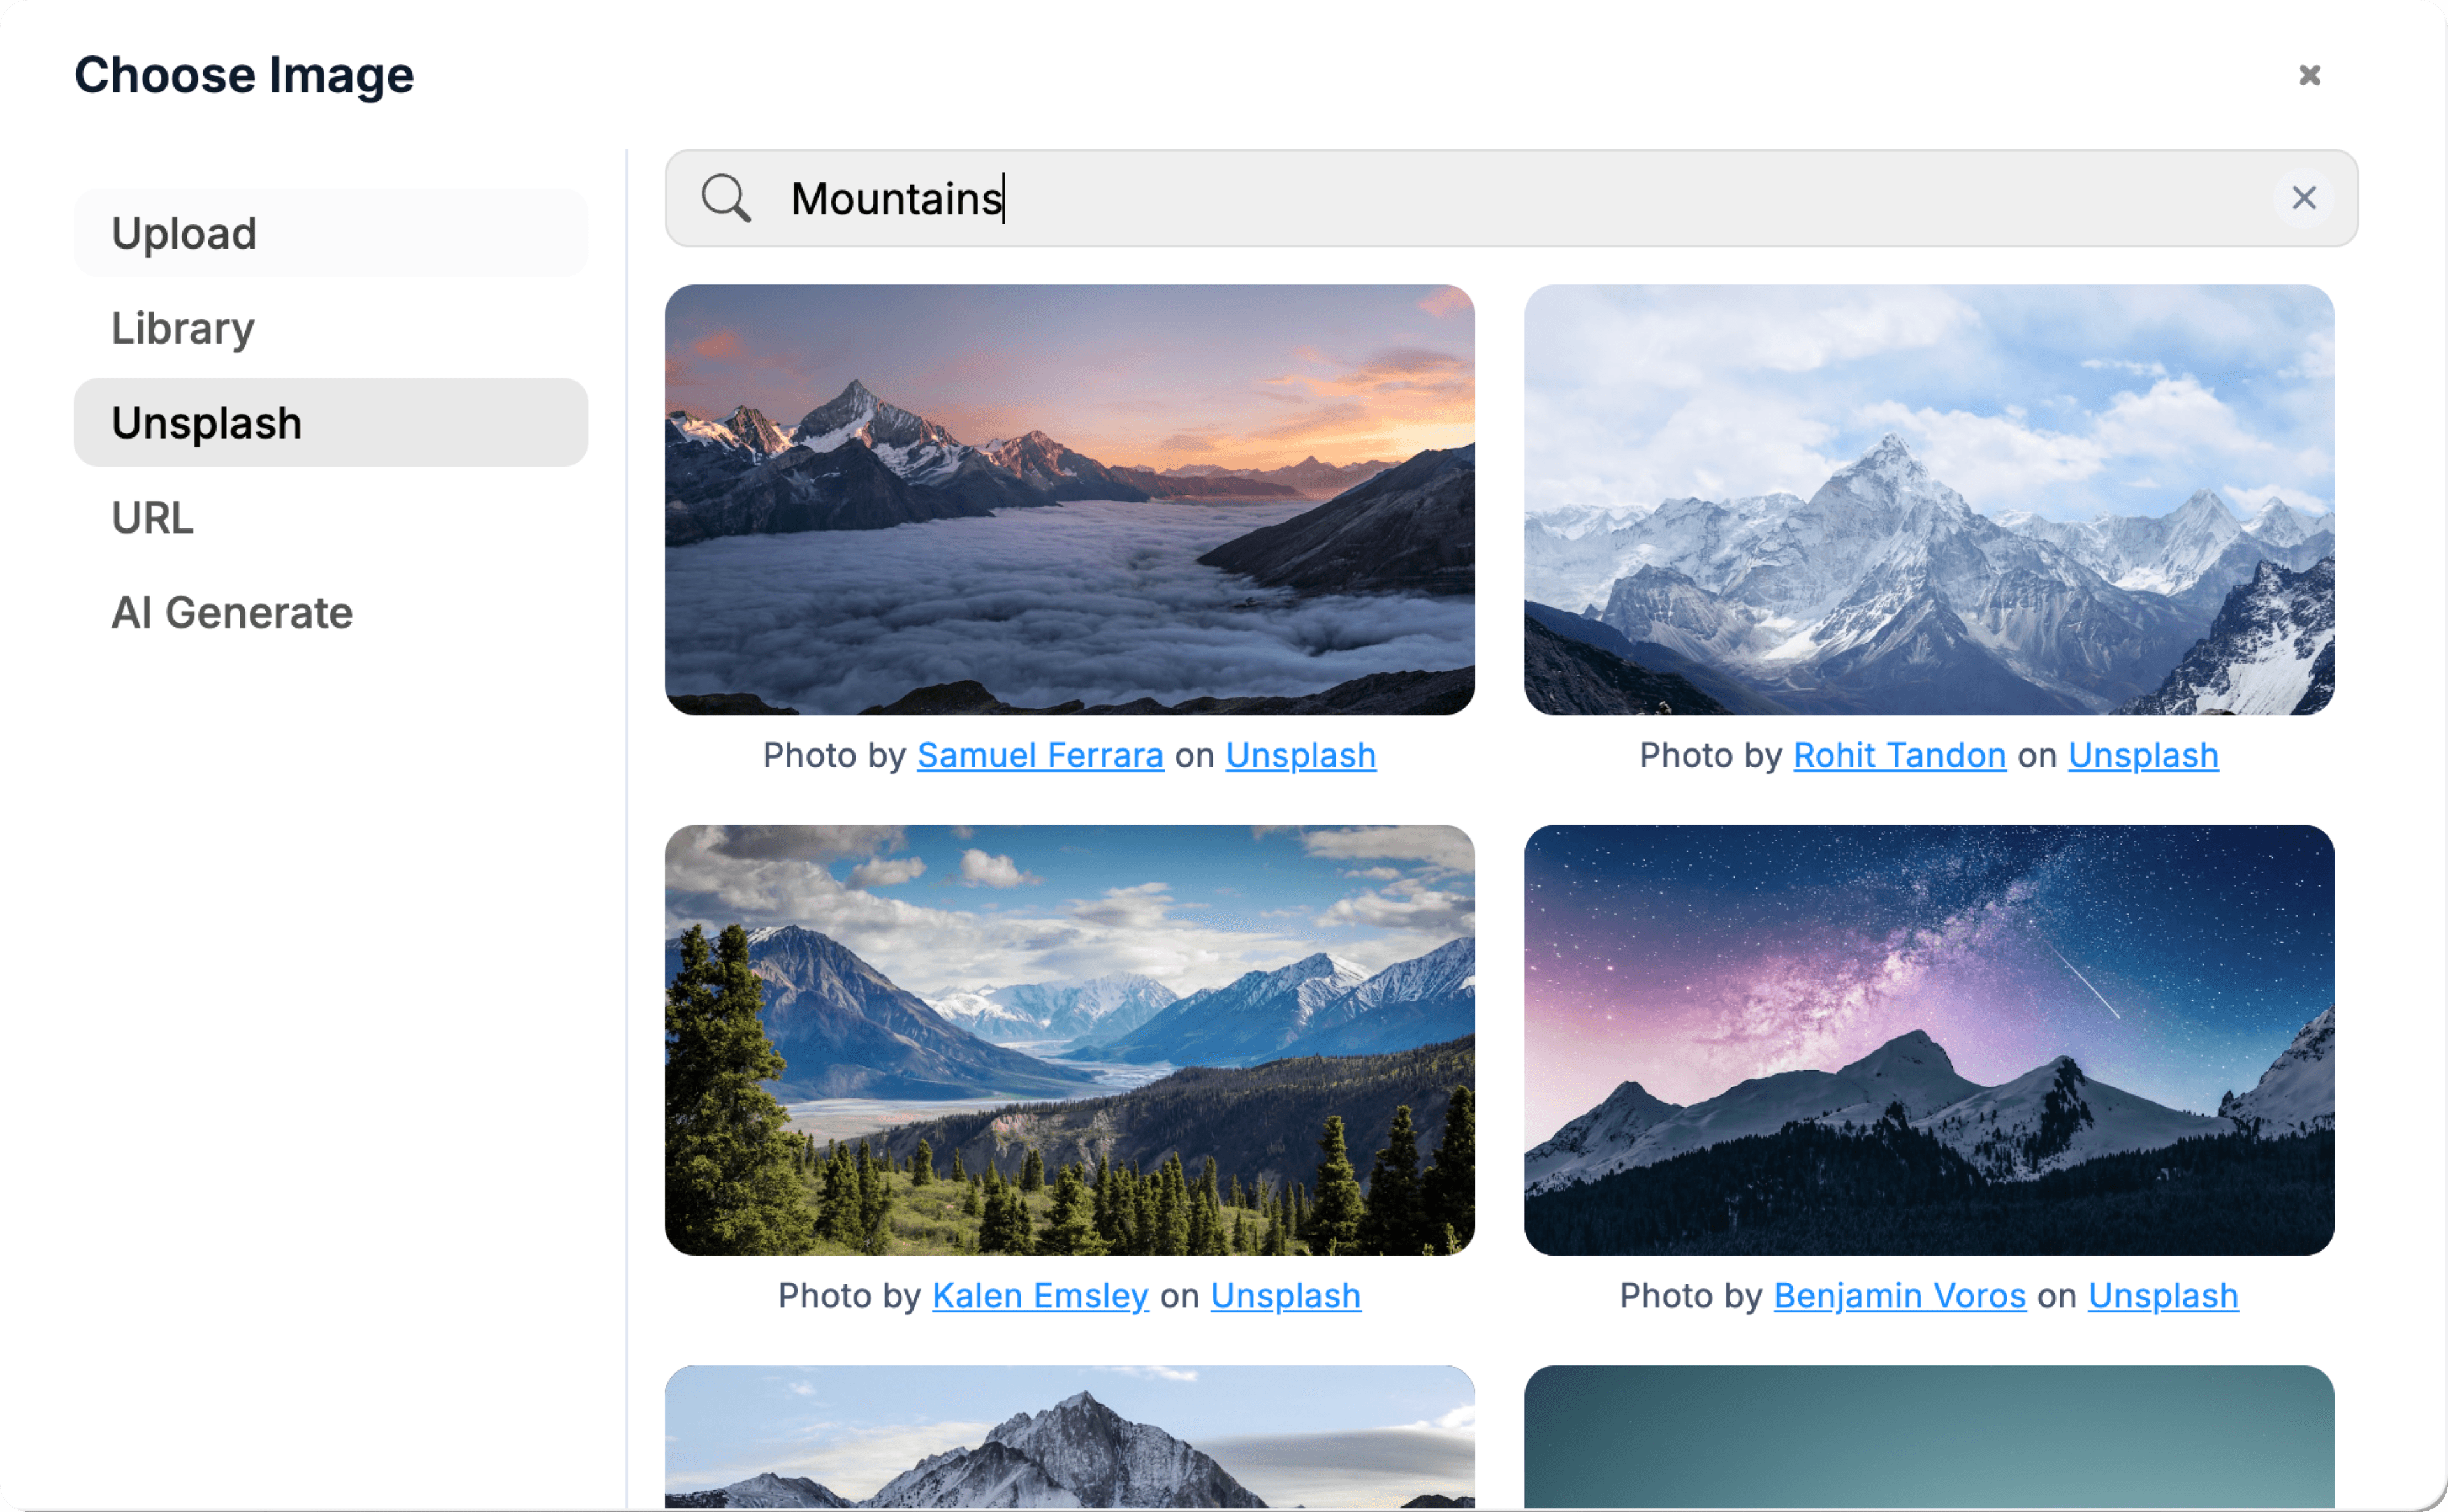
Pull in free imagery without leaving the canvas.
03 / Who it's for
Integrations
Works with the tools you already use.
Payments, database, AI, email and analytics, wired up the moment you connect.










04 / Why generate it
Cin7, Katana, SOS Inventory all start at $200-$400/month. For a small e-commerce or manufacturing operation that's real money on inventory tooling that should be cheaper than the inventory itself.
Inventory data integrates with everything: orders, accounting, suppliers. Owning the database means you choose how it connects instead of paying for vendor-specific connectors.
Everything you need to know before you generate it. Anything else, our team is one email away.
Yes. Each platform has an orders/inventory API. WebTwizz scaffolds polling jobs that fetch new orders and decrement stock. For real-time, use webhooks (Shopify pushes order events). Multi-channel inventory stays in sync without copy-paste.
For each SKU: reorder_point = (avg_daily_sales × supplier_lead_time_days) + safety_stock. When stock drops below the reorder point, an alert fires (email or Slack). Alerts can suggest order quantity based on target days-of-cover.
Transfers are a row in a transfers table: from_location, to_location, sku, quantity, status. When created, the from-location's stock decrements; on arrival, the to-location increments. In-transit stock visible separately on the dashboard.
Basic forecasting is straightforward: avg sales × seasonality factor × lead time = order quantity. For ML-based forecasting (smart trend detection), pipe historical sales into a small Python script via a serverless function. WebTwizz scaffolds the basics; ML is an add-on.
Keep building
Describe what you want. WebTwizz builds the real thing, then you click to change anything. No code needed.
Get started for free, no credit card needed.